
- Title
-
ALDH1A3-acetaldehyde metabolism potentiates transcriptional heterogeneity in melanoma
- Authors
- Lu, Y., Travnickova, J., Badonyi, M., Rambow, F., Coates, A., Khan, Z., Marques, J., Murphy, L.C., Garcia-Martinez, P., Marais, R., Louphrasitthiphol, P., Chan, A.H.Y., Schofield, C.J., von Kriegsheim, A., Marsh, J.A., Pavet, V., Sansom, O.J., Illingworth, R.S., Patton, E.E.
- Source
- Full text @ Cell Rep.
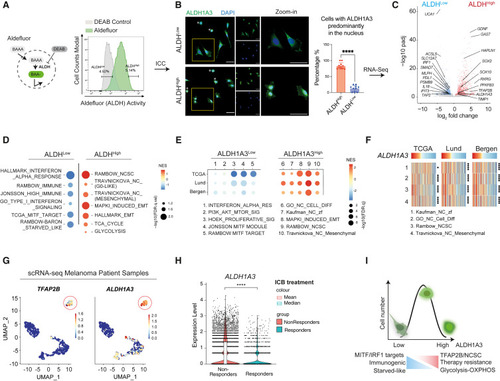
ALDH1A3High melanomas are enriched for NCSC and glucose metabolic states (A) ALDHHigh and ALDHLow melanoma cell subpopulations. The Aldefluor assay quantifies ALDH activity in live cells by measuring the accumulated fluorescence from converted BODIPY-aminoacetaldehyde (BAAA) to BODIPY-aminoacetate (BAA−). Highest and lowest Aldefluor activity, termed ALDHHigh and ALDHLow subpopulations, were isolated by FACS. Negative control: diemethylaminobenzaldehyde (DEAB), a pan-ALDH inhibitor. (B) ALDH1A3 cellular localization and levels. Immunocytochemistry (ICC) staining by fluorescence antibody labeling ALDH1A3 in A375 sorted ALDHHigh and ALDHLow cells. Scale bar, 50 μm. Quantification of cells enriched with nuclear ALDH1A3: experiment repeat n = 2, quantified image fields: 11 for ALDHHigh and 9 for ALDHLow, mean ± SD; non-paired Kolmogorov-Smirnov test, ∗∗∗∗p < 0.0001. Cells showing minimal cytoplastic content outside DAPI-stained regions (indicated with an asterisk [∗]) were determined as unfit following FACS and thus excluded from quantification. (C) Differential gene expression in ALDHHigh and ALDHLow melanoma cells. Volcano plot showing differentially expressed genes analyzed from DESeq2. n = 3, fold change >1, adjusted p <0.05. See also Table S1 . (D and E) Gene set enrichment analysis in melanoma cells and patient samples. Dot plot of pathway analysis showing significantly enriched terms (D) in ALDHHigh and ALDHLow cells and (E) in ALDH1A3High and ALDH1A3Low patient samples. Dot sizes represent -log10 FDR q value (weighted Kolmogorov-Smirnov test) and colors indicate normalized enrichment score (NES). Patient groups are defined in Figure S1 G. See also Tables S1 and S2 . (F) Heatmap of NCSC gene sets variation analysis (GVSA) score from patient samples ranked by the ALDH1A3 level. Melanoma patient samples from The Cancer Genome Atlas (TCGA), Lund, and Bergen cohorts unanimously showed positive correlation between ALDH1A3 and NCSC gene sets as annotated. ∗p < 0.05, ∗∗∗∗p < 0.0001, Spearman’s rank correlation critical probability exact (p) value. (G) ALDH1A3 and TFAP2B scRNA-seq cluster in metastatic patient samples. Uniform manifold approximation and projection (UMAP) feature plot showing expression level of ALDH1A3 and TFAP2B in scRNA-seq of re-analyzed patient samples of metastatic melanomas. 47 Red circle highlights an ALDH1A3 and TFAP2B cluster. (H) ALDH1A3 levels are significantly higher in ICB non-responders. scRNA-seq data from approximately 14, 200 malignant cells from Pozniak et al., 2024 48 were interrogated for ALDH1A3 expression and early response to ICB. ∗∗∗∗p < 0.0001, Wilcoxon signed-rank test. (I) Schematic of ALDH1A3 activity stratified states. High levels of ALDH1A3 Aldefluor activity are associated with nuclear localization and a high glucose metabolism and TFAP2B-NC stem cell dual state. Low levels of ALDH1A3 Aldefluor activity are associated with a differentiated, immunogenic, and starved-like state. See also Figure S1 and Tables S1 and S2 . |
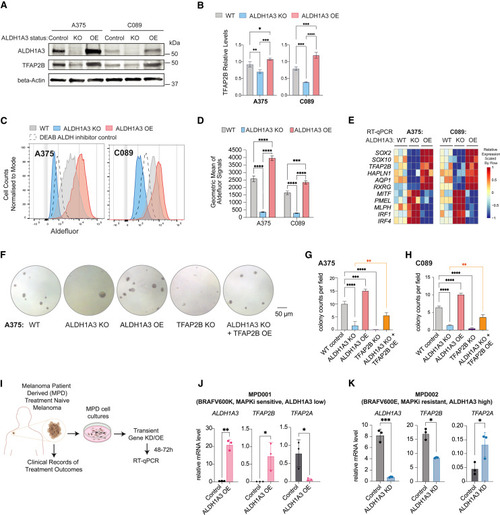
TFAP2B promotes stemness and dedifferentiation in ALDH1A3High melanoma cells (A and B) TFAP2B protein levels are dependent on ALDH1A3. Western blot and quantification of ALDH1A3 and TFAP2B protein expression in ALDH1A3 control, KO, and OE cells. n = 3, mean ± SD; one-way ANOVA with Tukey’s test for multiple comparisons. (C and D) ALDH1A3 melanoma cell models. Aldefluor activity and quantification in ALDH1A3 KO, OE, and vehicle control cells (A375 and C089 cells). n = 3, mean ± SD; one-way ANOVA with Tukey’s test correction for multiple comparisons. (E) The ALDH1A3-NC stem cell (NCSC) gene signature. RT-qPCR results of NCSC signature genes in control versus ALDH1A3 KO and OE cells (A375 and C089 cells, three bio-replicants with three technical replicates each). (F–H) TFAP2B rescues ALDH1A3 activity in colony assays. Representative images and quantification of colonies formed by A375 cell control, ALDH1A3 KO, ALDH1A3 OE, TFAP2B KO, and combined ALDH1A3 KO with TFAP2B OE conditions. Quantification on both A375 and C089 cells across each condition group, n = 3 per condition, mean ± SD one-way ANOVA with Tukey’s test for multiple comparisons. (I) Schematics of the establishment of low-passage melanoma patient-derived (MPD) cells and experimental design for molecular profiling of ALDH1A3 target genes. (J and K) ALDH1A3 OE promotes TFAP2B expression in low-passage patient cells. MPD 001 and 002 cells are ALDH1A3 low, MAPKi sensitive, ALDH1A3 high, and MAPKi resistant, respectively. RT-qPCR of ALDH1A3, TFAP2A, TFAP2B expression in control cells and cells over-expressing ALDH1A3. n = 3, mean ± SD; multiple non-paired t test corrected with Holm-Sidak’s method. ∗p < 0.05; ∗∗p < 0.01; ∗∗∗p < 0.001; ∗∗∗∗p < 0.0001. See also Figure S2 . |
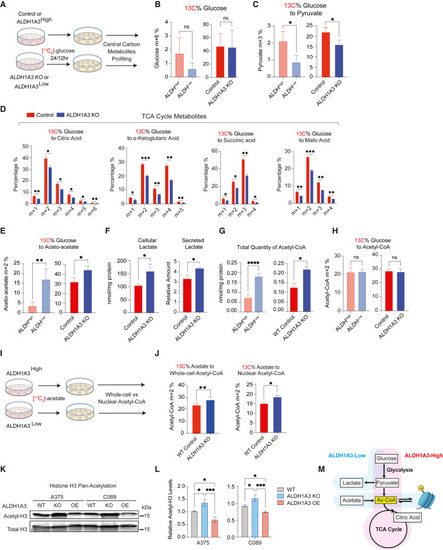
ALDH1A3High cells use glucose while ALDH1A3Low cells rely on acetate for acetyl-CoA production (A–E) (A) Schematic of 13C6 glucose tracing experiment. Central carbon metabolites were profiled by UPLC-MRM/MS (ultra-performance liquid chromatography electrospray ionization-tandem mass spectrometry in multiple reactions monitoring [MRM] mode) in (B). Glucose (C) and pyruvate (D) TCA cycle metabolites: citrate, alpha-ketoglutarate, succinic acid, malic acid, and (E) aceto-acetate (n = 3 for WT vs. ALDH1A3 KO cells; n = 5 for ALDHHigh vs. ALDHLow cells. Multiple paired t test corrected with Holm-Sidak’s method.). (F) ALDH1A3 KO cells generate and secrete lactate. Intracellular lactate measured by targeted UPLC-MRM/MS (n = 3, multiple paired t test corrected with Holm-Sidak’s method). Secreted lactate levels were measured by a colorimetric lactate assay kit and normalized to standards (n = 3, unpaired student t test). (G and H) ALDH1A3 KO cells generate more acetyl-CoA but not from glucose. (G) Intracellular glucose without 13C6 labeling and (H) total acetyl-CoA measured by targeted UPLC-MRM/MS (n = 3, multiple paired t test corrected with Holm-Sidak’s method). (I and J) Schematic of 13C2 acetate tracing experiment. 13C2 acetate tracing experiment designed for 13C-incoporation profiling by high-pressure liquid chromatography (HPLC) in (J) whole-cell and nuclear acetyl-CoA. n = 5, two-way ANOVA corrected with Holm-Sidak’s method. (K and L) Western blot analyses of pan-acetyl-histone H3 (acetyl-K9 + K14 + K18 + K23 + K27) and total histone H3 protein levels in lysates of A375 and C089 cell lines with vehicle control (WT), ALDH1A3 KO, or ALDH1A3 OE, respectively, with total histone H3 probed as loading control and (L) quantification (n = 3, mean ± SD; one-way ANOVA with Tukey’s correction for multiple comparisons.). (M) Schematic of ALDH1A3 and metabolic states. ALDH1A3 acts through two different sources of acetyl (Ac)-CoA production: high glucose flux generates high levels of pyruvate, leading to Ac-CoA in ALDHHigh cells, while ALDHLow cells preferentially uptake acetate as an Ac-CoA source. ∗p < 0.05; ∗∗p < 0.01; ∗∗∗p < 0.001; ∗∗∗∗p < 0.0001. See also Figures S3 and S4 and Table S3 . |
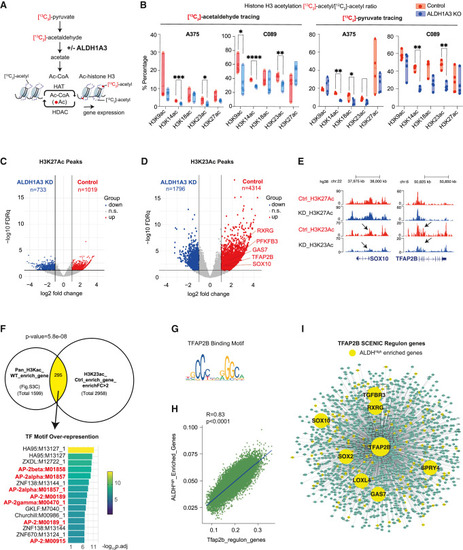
Pyruvate-derived acetaldehyde serves as an acetyl source for histone H3-acetylation (A) Schematic summarizing the acetyl group transfer from pyruvate to histone mediated by ALDH1A3 metabolizing acetaldehyde, with the experiment design that 13C2-acetaldehyde and/or 13C3-pyruvate-derived acetyl groups can be traced to histone acetylation. (B) Pyruvate-derived acetaldehyde is an acetyl source across multiple lysine residues on histone H3. 13C2-acetyl groups were traced from acetaldehyde into lysine acetylation at K9, K14, K18, K23, and K27, measured by HPLC-MS/MS. ALDH1A3 KO cells treated with 13C2-acetaldehyde showed fewer 13C2-acetyl groups at K9, K14, and K23 residues. Similar differential patterns of 13C2-acetyl group incorporation at histone H3 were observed when cells were treated with 13C3 sodium pyruvate. n = 5 per cell line; p values by two-way ANOVA with Sidak’s multiple comparisons test. (C and D) Volcano plot of differentially acetylated histone H3K27 peaks (C) and H3K23 peaks (D) from CUT&TAG in MPD002 control and ALDH1A3 KD cells (highlighted by red and blue respectively, fold change >2, FDR q <0.05). Representative NCSC gene-related peaks are annotated in the control enriched H3K23 peaks. (E) Gene tracks of acetylated histone H3K27 and H3K23 peaks in MPD002 vehicle control versus ALDH1A3 KD cells at representative NCSC genes. No significant changes are present in H3K27, while the significant change in H3K23 acetylation is observed. (F) Venn diagram of overlapping genes between (upper left) genes enriched in A375 control cells versus ALDH1A3 KO cells mapped from total histone H3 acetylation and (upper right) MPD002 control cells versus ALDH1A3 knockdown cells mapped from histone H3K23 acetylation. p values by Fisher’s exact test. Transcription factor binding motif over-representation analysis of the Venn diagram overlapping genes (lower panel) showed significant enrichment of AP-2 binding motif, with enrichment score by g:Profiler (e111_eg58_p18_30541362) with g:SCS multiple testing correction method applying statistical significance threshold of 0.05. 64 (G) Binding motif of human TFAP2B from JASPAR database. (H) Scatterplot shows the correlation of ALDHHigh enriched gene signature and Tfap2b regulon activities (AUCell score) in murine melanoma cells (NRASQ61K/°;Ink4a−/−). 46 (I) SCENIC-inferred Tfap2b regulatory network using a murine mouse scRNA-seq dataset, 46 with Tfap2b target genes in green and ALDHHigh enriched Tfap2b target genes highlighted in yellow. Tfap2b regulon genes were mapped to human homologs to allow comparison and visualization. See also Figures S3 and S4 and Tables S4 and S5 . |
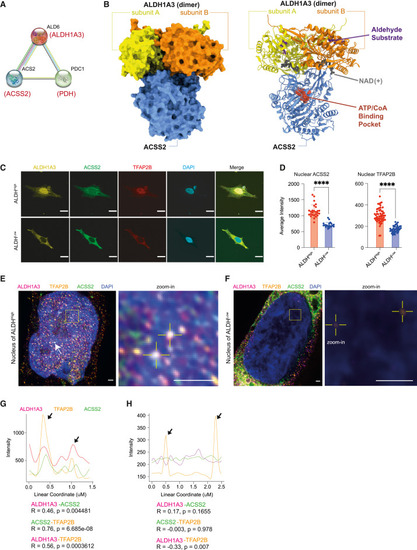
ALDH1A3 forms a predicted complex with ACSS2 (A) ALDH1A3 functional association. STRING functional protein association analysis between yeast Ald6, Acs2, and Pdc1, orthologous to human ALDH1A3, ACSS2, and PDH. (B) AlphaFold Multimer modeling of human ALDH1A3 and ACSS2. Proteins visualized as a complex in surface model (left) and ribbon model (right). The binding sites of an aldehyde substrate (retinaldehyde) and co-factor (NAD+) were created by structural alignment of the AlphaFold-Monomer predicted structure to PDB: 5fhz , a published tetramer ALDH1A3 structure. The ATP/CoA binding pocket of ACSS2 was visualized by structural alignment of AlphaFill-optimized protein-ligand complexes (ATP donor, PDB: 5k8f . CoA donor, PDB: 3gpc ). (C and D) Subcellular expression of ALDH1A3, ACSS2, and TFAP2B. (C) ICC staining by fluorescence antibody probing ALDH1A3 (yellow), ACSS2 (green), and TFAP2B (red) in sorted A375 ALDHHigh and ALDHLow cells. DAPI (blue). Scale bar, 10 μm. (D) Fluorescence signal intensity quantification of nuclear TFAP2B and ACSS2 in ICC images. 2 biological repeat experiments, n = 55 quantified single cells for ALDHHigh TFAP2B, n = 46 single cells for ALDHLow TFAP2B; n = 26 single cells for ALDHHigh ACSS2, n = 20 single cells for ALDHLow ACSS2 (represented as individual dots), mean ± SD, unpaired non-parametric Kolmogorov-Smirnov test. ∗∗∗∗p < 0.0001. (E and F) ALDH1A3, ACSS2, and TFAP2B co-localize in the nucleus. Structured illumination microscopy (SIM) of ALDH1A3 (magenta), TFAP2B (orange), ACSS2 (green), and DAPI (blue) in A375 melanoma FACS-sorted (E) ALDHHigh cells and (F) ALDHLow cells. Scale bar, 1 μm. Complex co-localization signals were abundant (arrows) and are indicated as highlighted dots in the zoomed image in (E). Low signals of nuclear TFAP2B are highlighted in zoomed image in (F). (G) Intensity plot profiles of the line scan across two co-localization hotspots in zoomed image of (E). Signal overlap peaks are indicated by arrows. Pearson correlation test. (H) Intensity plot profile of the line scan across the two TFAP2B signal spots in zoomed image of (F). TFAP2B signal peaks are indicated by arrows, where no ALDH1A3 or ACSS2 signals are present. Pearson correlation test. See also Figure S5 . |
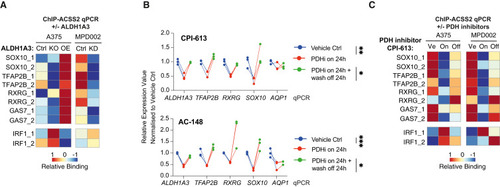
Acetaldehyde serves as an acetyl source for histone H3-acetylation (A) ALDH1A3 directs gene-specific ACSS2 chromatin binding. ACSS2 ChIP-qPCR results in (left) A375 WT control versus ALDH1A3 KO and ALDH1A3 OE cells, as well as in (right) MPD002 control versus ALDH1A3 KD cells (siALDH1A3). n = 3 biological replicates each with 3 technical replicates and normalized to immunoglobulin (Ig) G control. (B) RT-qPCR-measured NCSC gene expression change in A375 and MPD002 in response to pyruvate dehydrogenase (PDH) activity change induced by PDH inhibitors (PDHis) CPI-613 (upper) and AC-148 (lower). ∗p < 0.05; ∗∗p < 0.01; ∗∗∗p < 0.001; one-way ANOVA with Sidak’s correction. (C) ALDH1A3-directed gene-specific ACSS2 chromatin binding relies on PDH activity. ACSS2 ChIP-qPCR results in A375 and MPD002 cells with vehicle control (Ve) versus PDH inhibitor CPI-613-treated samples (on, 24 h) and PDH inhibitor wash-off samples (24-h treatment followed by additional 24-h wash-off recovery, off). n = 2 biological repeat experiments in both A375 and MPD002 cells, each with 3 technical replicates and normalized to IgG control before heatmap scaling and plotting. |
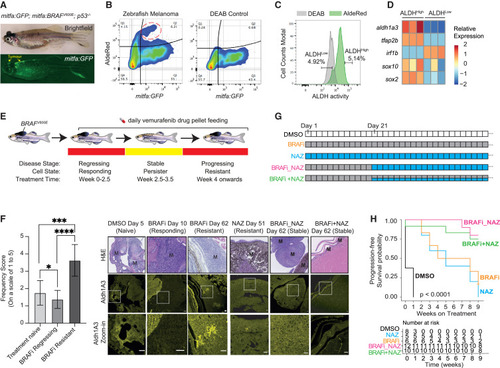
ALDH1A3High subpopulations promote melanoma drug resistance in vivo (A) Zebrafish BRAFV600E melanoma model (arrow indicates melanoma). BRAFV600E and GFP are expressed in the melanocyte lineage, by the mitfa promoter, and the zebrafish is mutant for p53. (B–D) ALDHHigh cells with low levels of mitfa:GFP in zebrafish melanoma (red circle). DEAB: negative control. (C) FACS of ALDHHigh and ALDHLow zebrafish melanoma cells. (D) RT-qPCR of sox2, sox10, and tfap2b expression in sorted ALDHHigh versus ALDHLow zebrafish melanoma cells (n = 3 bio-replicates each with 3 technical replicates, multiple paired t test corrected with Holm-Sidak’s method). (E and F) Aldh1a3 in zebrafish model of BRAF inhibitor regression and recurrent disease. (E) BRAFV600E p53 mutant zebrafish with melanomas were fed with 200 mg/kg/day vemurafenib-containing food pellets leading to melanoma regression, drug resistance. and disease recurrence. (F) Aldh1a3 IHC in DMSO, BRAFi, and/or NAZ treatment-responding disease and in drug-resistant recurrent disease shows Aldh1a3 on-target efficacy of nifuroxazide. One-way ANOVA with Tukey’s test correction for multiple comparisons. Scale bar = 25 μm. ∗p < 0.05; ∗∗∗p < 0.001; ∗∗∗∗p < 0.0001. (G and H) Zebrafish combination drug trial to target ALDHHigh cells. (G) Long-term drug-pellet treatment design. (H) Kaplan-Meier survival curves of zebrafish melanomas under different drug treatment shown in (G). Log rank tests, p < 0.001. See also Figure S6 . |