
Fig. 5
- ID
- ZDB-FIG-240801-47
- Publication
- Lu et al., 2024 - ALDH1A3-acetaldehyde metabolism potentiates transcriptional heterogeneity in melanoma
- Other Figures
- All Figure Page
- Back to All Figure Page
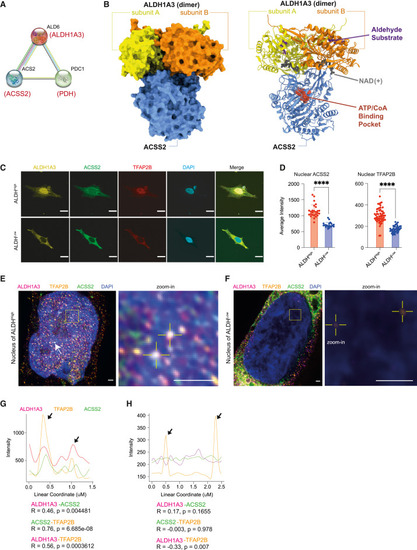
ALDH1A3 forms a predicted complex with ACSS2 (A) ALDH1A3 functional association. STRING functional protein association analysis between yeast Ald6, Acs2, and Pdc1, orthologous to human ALDH1A3, ACSS2, and PDH. (B) AlphaFold Multimer modeling of human ALDH1A3 and ACSS2. Proteins visualized as a complex in surface model (left) and ribbon model (right). The binding sites of an aldehyde substrate (retinaldehyde) and co-factor (NAD+) were created by structural alignment of the AlphaFold-Monomer predicted structure to PDB: 5fhz , a published tetramer ALDH1A3 structure. The ATP/CoA binding pocket of ACSS2 was visualized by structural alignment of AlphaFill-optimized protein-ligand complexes (ATP donor, PDB: 5k8f . CoA donor, PDB: 3gpc ). (C and D) Subcellular expression of ALDH1A3, ACSS2, and TFAP2B. (C) ICC staining by fluorescence antibody probing ALDH1A3 (yellow), ACSS2 (green), and TFAP2B (red) in sorted A375 ALDHHigh and ALDHLow cells. DAPI (blue). Scale bar, 10 μm. (D) Fluorescence signal intensity quantification of nuclear TFAP2B and ACSS2 in ICC images. 2 biological repeat experiments, n = 55 quantified single cells for ALDHHigh TFAP2B, n = 46 single cells for ALDHLow TFAP2B; n = 26 single cells for ALDHHigh ACSS2, n = 20 single cells for ALDHLow ACSS2 (represented as individual dots), mean ± SD, unpaired non-parametric Kolmogorov-Smirnov test. ∗∗∗∗p < 0.0001. (E and F) ALDH1A3, ACSS2, and TFAP2B co-localize in the nucleus. Structured illumination microscopy (SIM) of ALDH1A3 (magenta), TFAP2B (orange), ACSS2 (green), and DAPI (blue) in A375 melanoma FACS-sorted (E) ALDHHigh cells and (F) ALDHLow cells. Scale bar, 1 μm. Complex co-localization signals were abundant (arrows) and are indicated as highlighted dots in the zoomed image in (E). Low signals of nuclear TFAP2B are highlighted in zoomed image in (F). (G) Intensity plot profiles of the line scan across two co-localization hotspots in zoomed image of (E). Signal overlap peaks are indicated by arrows. Pearson correlation test. (H) Intensity plot profile of the line scan across the two TFAP2B signal spots in zoomed image of (F). TFAP2B signal peaks are indicated by arrows, where no ALDH1A3 or ACSS2 signals are present. Pearson correlation test. See also Figure S5 . |