
Fig. 1
- ID
- ZDB-FIG-240801-43
- Publication
- Lu et al., 2024 - ALDH1A3-acetaldehyde metabolism potentiates transcriptional heterogeneity in melanoma
- Other Figures
- All Figure Page
- Back to All Figure Page
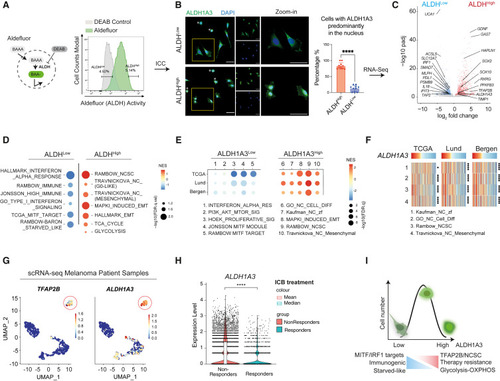
ALDH1A3High melanomas are enriched for NCSC and glucose metabolic states (A) ALDHHigh and ALDHLow melanoma cell subpopulations. The Aldefluor assay quantifies ALDH activity in live cells by measuring the accumulated fluorescence from converted BODIPY-aminoacetaldehyde (BAAA) to BODIPY-aminoacetate (BAA−). Highest and lowest Aldefluor activity, termed ALDHHigh and ALDHLow subpopulations, were isolated by FACS. Negative control: diemethylaminobenzaldehyde (DEAB), a pan-ALDH inhibitor. (B) ALDH1A3 cellular localization and levels. Immunocytochemistry (ICC) staining by fluorescence antibody labeling ALDH1A3 in A375 sorted ALDHHigh and ALDHLow cells. Scale bar, 50 μm. Quantification of cells enriched with nuclear ALDH1A3: experiment repeat n = 2, quantified image fields: 11 for ALDHHigh and 9 for ALDHLow, mean ± SD; non-paired Kolmogorov-Smirnov test, ∗∗∗∗p < 0.0001. Cells showing minimal cytoplastic content outside DAPI-stained regions (indicated with an asterisk [∗]) were determined as unfit following FACS and thus excluded from quantification. (C) Differential gene expression in ALDHHigh and ALDHLow melanoma cells. Volcano plot showing differentially expressed genes analyzed from DESeq2. n = 3, fold change >1, adjusted p <0.05. See also Table S1 . (D and E) Gene set enrichment analysis in melanoma cells and patient samples. Dot plot of pathway analysis showing significantly enriched terms (D) in ALDHHigh and ALDHLow cells and (E) in ALDH1A3High and ALDH1A3Low patient samples. Dot sizes represent -log10 FDR q value (weighted Kolmogorov-Smirnov test) and colors indicate normalized enrichment score (NES). Patient groups are defined in Figure S1 G. See also Tables S1 and S2 . (F) Heatmap of NCSC gene sets variation analysis (GVSA) score from patient samples ranked by the ALDH1A3 level. Melanoma patient samples from The Cancer Genome Atlas (TCGA), Lund, and Bergen cohorts unanimously showed positive correlation between ALDH1A3 and NCSC gene sets as annotated. ∗p < 0.05, ∗∗∗∗p < 0.0001, Spearman’s rank correlation critical probability exact (p) value. (G) ALDH1A3 and TFAP2B scRNA-seq cluster in metastatic patient samples. Uniform manifold approximation and projection (UMAP) feature plot showing expression level of ALDH1A3 and TFAP2B in scRNA-seq of re-analyzed patient samples of metastatic melanomas. 47 Red circle highlights an ALDH1A3 and TFAP2B cluster. (H) ALDH1A3 levels are significantly higher in ICB non-responders. scRNA-seq data from approximately 14, 200 malignant cells from Pozniak et al., 2024 48 were interrogated for ALDH1A3 expression and early response to ICB. ∗∗∗∗p < 0.0001, Wilcoxon signed-rank test. (I) Schematic of ALDH1A3 activity stratified states. High levels of ALDH1A3 Aldefluor activity are associated with nuclear localization and a high glucose metabolism and TFAP2B-NC stem cell dual state. Low levels of ALDH1A3 Aldefluor activity are associated with a differentiated, immunogenic, and starved-like state. See also Figure S1 and Tables S1 and S2 . |