
Fig. 3
- ID
- ZDB-FIG-240801-45
- Publication
- Lu et al., 2024 - ALDH1A3-acetaldehyde metabolism potentiates transcriptional heterogeneity in melanoma
- Other Figures
- All Figure Page
- Back to All Figure Page
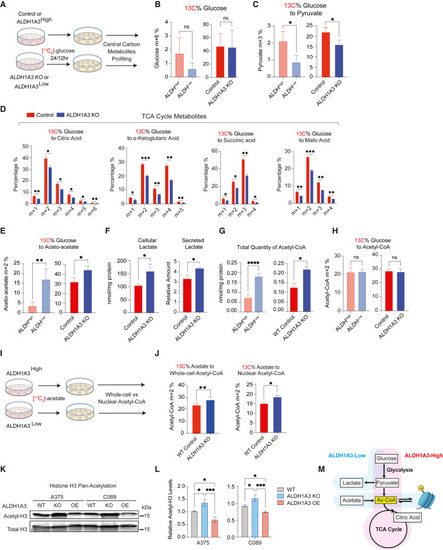
ALDH1A3High cells use glucose while ALDH1A3Low cells rely on acetate for acetyl-CoA production (A–E) (A) Schematic of 13C6 glucose tracing experiment. Central carbon metabolites were profiled by UPLC-MRM/MS (ultra-performance liquid chromatography electrospray ionization-tandem mass spectrometry in multiple reactions monitoring [MRM] mode) in (B). Glucose (C) and pyruvate (D) TCA cycle metabolites: citrate, alpha-ketoglutarate, succinic acid, malic acid, and (E) aceto-acetate (n = 3 for WT vs. ALDH1A3 KO cells; n = 5 for ALDHHigh vs. ALDHLow cells. Multiple paired t test corrected with Holm-Sidak’s method.). (F) ALDH1A3 KO cells generate and secrete lactate. Intracellular lactate measured by targeted UPLC-MRM/MS (n = 3, multiple paired t test corrected with Holm-Sidak’s method). Secreted lactate levels were measured by a colorimetric lactate assay kit and normalized to standards (n = 3, unpaired student t test). (G and H) ALDH1A3 KO cells generate more acetyl-CoA but not from glucose. (G) Intracellular glucose without 13C6 labeling and (H) total acetyl-CoA measured by targeted UPLC-MRM/MS (n = 3, multiple paired t test corrected with Holm-Sidak’s method). (I and J) Schematic of 13C2 acetate tracing experiment. 13C2 acetate tracing experiment designed for 13C-incoporation profiling by high-pressure liquid chromatography (HPLC) in (J) whole-cell and nuclear acetyl-CoA. n = 5, two-way ANOVA corrected with Holm-Sidak’s method. (K and L) Western blot analyses of pan-acetyl-histone H3 (acetyl-K9 + K14 + K18 + K23 + K27) and total histone H3 protein levels in lysates of A375 and C089 cell lines with vehicle control (WT), ALDH1A3 KO, or ALDH1A3 OE, respectively, with total histone H3 probed as loading control and (L) quantification (n = 3, mean ± SD; one-way ANOVA with Tukey’s correction for multiple comparisons.). (M) Schematic of ALDH1A3 and metabolic states. ALDH1A3 acts through two different sources of acetyl (Ac)-CoA production: high glucose flux generates high levels of pyruvate, leading to Ac-CoA in ALDHHigh cells, while ALDHLow cells preferentially uptake acetate as an Ac-CoA source. ∗p < 0.05; ∗∗p < 0.01; ∗∗∗p < 0.001; ∗∗∗∗p < 0.0001. See also Figures S3 and S4 and Table S3 . |