
Fig. 2
- ID
- ZDB-FIG-240801-44
- Publication
- Lu et al., 2024 - ALDH1A3-acetaldehyde metabolism potentiates transcriptional heterogeneity in melanoma
- Other Figures
- All Figure Page
- Back to All Figure Page
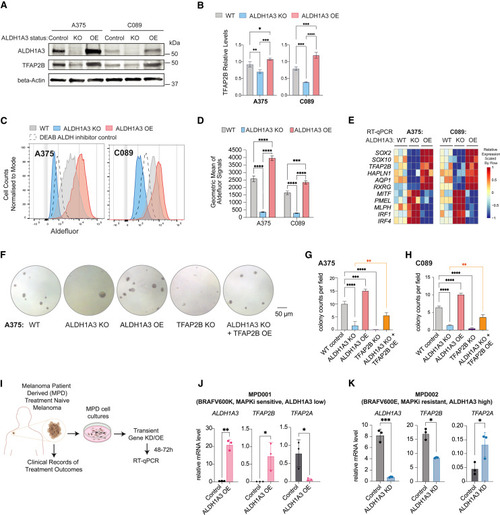
TFAP2B promotes stemness and dedifferentiation in ALDH1A3High melanoma cells (A and B) TFAP2B protein levels are dependent on ALDH1A3. Western blot and quantification of ALDH1A3 and TFAP2B protein expression in ALDH1A3 control, KO, and OE cells. n = 3, mean ± SD; one-way ANOVA with Tukey’s test for multiple comparisons. (C and D) ALDH1A3 melanoma cell models. Aldefluor activity and quantification in ALDH1A3 KO, OE, and vehicle control cells (A375 and C089 cells). n = 3, mean ± SD; one-way ANOVA with Tukey’s test correction for multiple comparisons. (E) The ALDH1A3-NC stem cell (NCSC) gene signature. RT-qPCR results of NCSC signature genes in control versus ALDH1A3 KO and OE cells (A375 and C089 cells, three bio-replicants with three technical replicates each). (F–H) TFAP2B rescues ALDH1A3 activity in colony assays. Representative images and quantification of colonies formed by A375 cell control, ALDH1A3 KO, ALDH1A3 OE, TFAP2B KO, and combined ALDH1A3 KO with TFAP2B OE conditions. Quantification on both A375 and C089 cells across each condition group, n = 3 per condition, mean ± SD one-way ANOVA with Tukey’s test for multiple comparisons. (I) Schematics of the establishment of low-passage melanoma patient-derived (MPD) cells and experimental design for molecular profiling of ALDH1A3 target genes. (J and K) ALDH1A3 OE promotes TFAP2B expression in low-passage patient cells. MPD 001 and 002 cells are ALDH1A3 low, MAPKi sensitive, ALDH1A3 high, and MAPKi resistant, respectively. RT-qPCR of ALDH1A3, TFAP2A, TFAP2B expression in control cells and cells over-expressing ALDH1A3. n = 3, mean ± SD; multiple non-paired t test corrected with Holm-Sidak’s method. ∗p < 0.05; ∗∗p < 0.01; ∗∗∗p < 0.001; ∗∗∗∗p < 0.0001. See also Figure S2 . |