
|
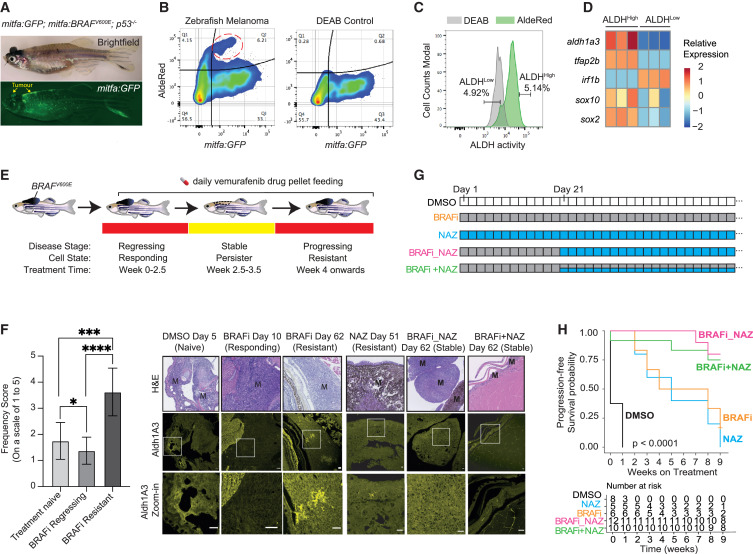
Fig. 7 ALDH1A3High subpopulations promote melanoma drug resistance in vivo (A) Zebrafish BRAFV600E melanoma model (arrow indicates melanoma). BRAFV600E and GFP are expressed in the melanocyte lineage, by the mitfa promoter, and the zebrafish is mutant for p53. (B–D) ALDHHigh cells with low levels of mitfa:GFP in zebrafish melanoma (red circle). DEAB: negative control. (C) FACS of ALDHHigh and ALDHLow zebrafish melanoma cells. (D) RT-qPCR of sox2, sox10, and tfap2b expression in sorted ALDHHigh versus ALDHLow zebrafish melanoma cells (n = 3 bio-replicates each with 3 technical replicates, multiple paired t test corrected with Holm-Sidak’s method). (E and F) Aldh1a3 in zebrafish model of BRAF inhibitor regression and recurrent disease. (E) BRAFV600E p53 mutant zebrafish with melanomas were fed with 200 mg/kg/day vemurafenib-containing food pellets leading to melanoma regression, drug resistance. and disease recurrence. (F) Aldh1a3 IHC in DMSO, BRAFi, and/or NAZ treatment-responding disease and in drug-resistant recurrent disease shows Aldh1a3 on-target efficacy of nifuroxazide. One-way ANOVA with Tukey’s test correction for multiple comparisons. Scale bar = 25 μm. ∗p < 0.05; ∗∗∗p < 0.001; ∗∗∗∗p < 0.0001. (G and H) Zebrafish combination drug trial to target ALDHHigh cells. (G) Long-term drug-pellet treatment design. (H) Kaplan-Meier survival curves of zebrafish melanomas under different drug treatment shown in (G). Log rank tests, p < 0.001. See also Figure S6 .