
|
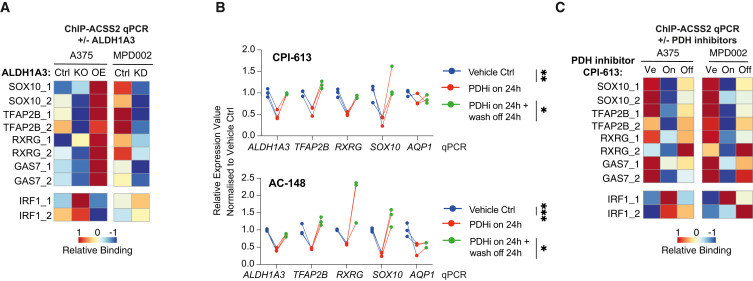
Fig. 6 Acetaldehyde serves as an acetyl source for histone H3-acetylation (A) ALDH1A3 directs gene-specific ACSS2 chromatin binding. ACSS2 ChIP-qPCR results in (left) A375 WT control versus ALDH1A3 KO and ALDH1A3 OE cells, as well as in (right) MPD002 control versus ALDH1A3 KD cells (siALDH1A3). n = 3 biological replicates each with 3 technical replicates and normalized to immunoglobulin (Ig) G control. (B) RT-qPCR-measured NCSC gene expression change in A375 and MPD002 in response to pyruvate dehydrogenase (PDH) activity change induced by PDH inhibitors (PDHis) CPI-613 (upper) and AC-148 (lower). ∗p < 0.05; ∗∗p < 0.01; ∗∗∗p < 0.001; one-way ANOVA with Sidak’s correction. (C) ALDH1A3-directed gene-specific ACSS2 chromatin binding relies on PDH activity. ACSS2 ChIP-qPCR results in A375 and MPD002 cells with vehicle control (Ve) versus PDH inhibitor CPI-613-treated samples (on, 24 h) and PDH inhibitor wash-off samples (24-h treatment followed by additional 24-h wash-off recovery, off). n = 2 biological repeat experiments in both A375 and MPD002 cells, each with 3 technical replicates and normalized to IgG control before heatmap scaling and plotting.