
Fig. 4
- ID
- ZDB-FIG-240801-46
- Publication
- Lu et al., 2024 - ALDH1A3-acetaldehyde metabolism potentiates transcriptional heterogeneity in melanoma
- Other Figures
- All Figure Page
- Back to All Figure Page
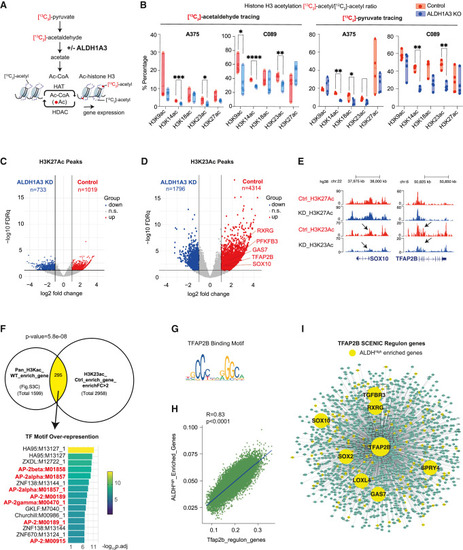
Pyruvate-derived acetaldehyde serves as an acetyl source for histone H3-acetylation (A) Schematic summarizing the acetyl group transfer from pyruvate to histone mediated by ALDH1A3 metabolizing acetaldehyde, with the experiment design that 13C2-acetaldehyde and/or 13C3-pyruvate-derived acetyl groups can be traced to histone acetylation. (B) Pyruvate-derived acetaldehyde is an acetyl source across multiple lysine residues on histone H3. 13C2-acetyl groups were traced from acetaldehyde into lysine acetylation at K9, K14, K18, K23, and K27, measured by HPLC-MS/MS. ALDH1A3 KO cells treated with 13C2-acetaldehyde showed fewer 13C2-acetyl groups at K9, K14, and K23 residues. Similar differential patterns of 13C2-acetyl group incorporation at histone H3 were observed when cells were treated with 13C3 sodium pyruvate. n = 5 per cell line; p values by two-way ANOVA with Sidak’s multiple comparisons test. (C and D) Volcano plot of differentially acetylated histone H3K27 peaks (C) and H3K23 peaks (D) from CUT&TAG in MPD002 control and ALDH1A3 KD cells (highlighted by red and blue respectively, fold change >2, FDR q <0.05). Representative NCSC gene-related peaks are annotated in the control enriched H3K23 peaks. (E) Gene tracks of acetylated histone H3K27 and H3K23 peaks in MPD002 vehicle control versus ALDH1A3 KD cells at representative NCSC genes. No significant changes are present in H3K27, while the significant change in H3K23 acetylation is observed. (F) Venn diagram of overlapping genes between (upper left) genes enriched in A375 control cells versus ALDH1A3 KO cells mapped from total histone H3 acetylation and (upper right) MPD002 control cells versus ALDH1A3 knockdown cells mapped from histone H3K23 acetylation. p values by Fisher’s exact test. Transcription factor binding motif over-representation analysis of the Venn diagram overlapping genes (lower panel) showed significant enrichment of AP-2 binding motif, with enrichment score by g:Profiler (e111_eg58_p18_30541362) with g:SCS multiple testing correction method applying statistical significance threshold of 0.05. 64 (G) Binding motif of human TFAP2B from JASPAR database. (H) Scatterplot shows the correlation of ALDHHigh enriched gene signature and Tfap2b regulon activities (AUCell score) in murine melanoma cells (NRASQ61K/°;Ink4a−/−). 46 (I) SCENIC-inferred Tfap2b regulatory network using a murine mouse scRNA-seq dataset, 46 with Tfap2b target genes in green and ALDHHigh enriched Tfap2b target genes highlighted in yellow. Tfap2b regulon genes were mapped to human homologs to allow comparison and visualization. See also Figures S3 and S4 and Tables S4 and S5 . |