
- Title
-
ABE-ultramax for high-efficiency biallelic adenine base editing in zebrafish
- Authors
- Qin, W., Liang, F., Lin, S.J., Petree, C., Huang, K., Zhang, Y., Li, L., Varshney, P., Mourrain, P., Liu, Y., Varshney, G.K.
- Source
- Full text @ Nat. Commun.
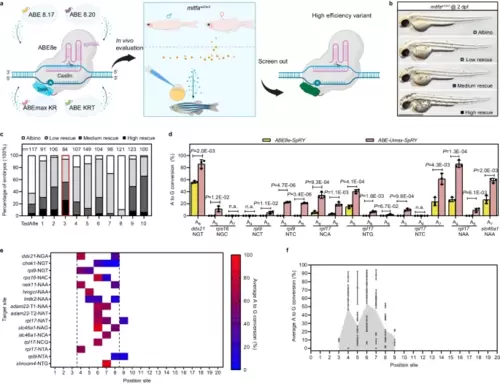
Efficient adenine base editing mediated by ABE-Umax-SpRY. a Schematic diagram of the screening process for efficient adenine base editing tools. Cas9n Cas nickase, TadA adenine deaminase, PAM protospacer adjacent motif, sgRNA single guide RNA. Different colors (blue, yellow, purple, pink, and green) represent various TadA variants used in the deaminases. Created with BioRender.com released under a Creative Commons Attribution-NonCommercial-NoDerivs 4.0 International license. b Lateral views of embryos at 2 days post-fertilization (dpf) are displayed. The degree of mosaic pigmentation compared to the mutant is categorized. Scale bar: 1 mm. c A comparison of the efficiency of various adenine base editing tools in correcting point mutations in the mitfaW2/W2 mutant line. The stacked columns display the percentages of albino (white), low rescue (light gray), medium rescue (dark gray), and high rescue (black) embryos. The count of embryos is displayed above each column. The most efficient tool, ABE-Umax-SpRY, is highlighted in a red box. d Editing efficiency comparison between ABE8e-SpRY and ABE-Umax-SpRY using nine gRNAs targeting NNN PAMs. The edited base position within each gRNA is indicated by numbers. Data were presented as mean ± standard deviation (SD) calculated from three biological replicates. Two-tailed paired t-test were performed (with P values marked). e The heatmap illustrates the mean A-to-G editing efficiency of ABE-Umax-SpRY across 16 target sites at various positions within the protospacer. Editing efficiency (A-to-G conversion) is depicted using a color gradient, ranging from red (100%) to blue (0%). A-to-G conversion frequencies for each adenine nucleotide within the 20-bp protospacer were quantified using EditR. The heatmap displays conversion frequencies exceeding 0.20, averaged across three independent experiments. The black dotted line delineates ABE-Umax-SpRY’s preferred editing window, encompassing positions 4 through 8. f Assessment of the efficiency and targeting window of ABE-Umax-SpRY. Each data point represents the average editing activity ± standard deviation (SD) at a particular site based on the data in Fig. 1d, e. The targeting window of ABE-Umax-SpRY is colored in gray from position 3 to 9, counting from the 5′ terminal to the 3′ terminal of the targeting site. All source data in this figure are provided as a source data file. |
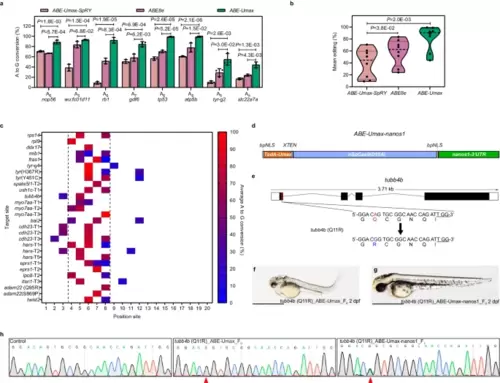
Efficient adenine base editing mediated by ABE-Umax. a The editing efficiency comparison among ABE-Umax-SpRY, ABE8e-SpRY, and ABE-Umax targeting eight different loci with NGG PAM. The editing base position within the gRNA is indicated by numbers. Values are presented as mean value ± standard deviation (SD), n = 3 biological replicates. Two-tailed paired t-test were performed (with P values marked). b Assessment of the mean editing efficiency of ABE-Umax-SpRY, ABE-Umax, and ABE8e Umax using the plot based on the data in Fig. 2a. Mean editing activity at each site is represented by individual data points, with the central dotted line indicating the overall mean. Two-tailed paired t-test were performed (with P values marked at the top of the violin plot.). c Heatmap depicting the average A-to-G editing efficiency of ABE-Umax across 28 target sites. Editing efficiency is represented by a color gradient, with red indicating 100% efficiency and blue indicating 0% efficiency. The black dotted line highlights the preferred editable range of ABE-Umax, between positions 4 and 8. d The mRNA construct of ABE-Umax-nanos1 for germline-specific adenine base editing. e Schematic diagram of the tubb4b locus. The targeted sequence is shown with the PAM underlined. The targeted nucleotide and amino acid are highlighted in red, while the expected changes in nucleotide and amino acid are highlighted in blue. f, g Phenotype of F0 embryos injected with tubb4b gRNA and ABE-Umax mRNA (f) or ABE-Umax-nanos1 mRNA (g). Lateral views of 2 dpf embryos are shown. Scale bar: 1 mm. h Sanger sequencing chromatograms confirm the A to G editing events in F0 injected embryos and F1. The desired mutation is indicated by a red arrowhead. All source data in this figure are provided as a source data file. |
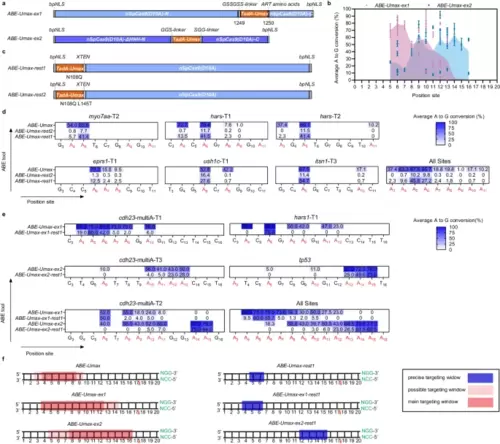
Expanding editing windows for efficient and precise adenine base editing by ABE-Umax variants. a Schematics showing constructs of ABE-Umax-ex1 and ABE-Umax-ex2 designed to shift the editing window of adenine base editing. b Assessment of the efficiency and targeting window of ABE-Umax-ex1 and ABE-Umax-ex2. Each data point represents the average editing activity at a particular site. The targeting window of ABE-Umax-ex1 is colored in pink from position 5 to 14, and the targeting window of ABE-Umax-ex2 is colored in blue from position 5 to 16, counting from the 5’ terminal to the 3’ terminal of the targeting site. Data from three independent experiments were analyzed. c The schematics of ABE-Umax-rest1 and ABE-Umax-rest2 constructs for precise adenine base editing. d Examining A-to-G editing efficiency of ABE-Umax, ABE-Umax-rest2, and ABE-Umax-rest1 across six endogenous genomic loci. Miseq was used to quantify A-to-G conversion frequencies at each adenine nucleotide within the 20-bp protospacer sequences. Results from three independent experiments were compiled, with editing frequencies above 20% labeled in the heatmap. Color mapping (blue to white) represents editing efficiency from 100 to 0%. Editing base positions within the gRNA are indicated by numbers. e Evaluating the editing efficiency and targeting window of ABE-Umax-ex1-rest1 and ABE-Umax-ex2-rest1. EditR quantified A-to-G conversion frequencies at every adenine within the 20-bp protospacer. Data from three independent experiments were analyzed, with editing frequencies above 20% labeled in the heatmap. Color mapping (blue to white) indicates editing efficiency from 100% to 0%. Editing base positions within the gRNA are numerically labeled. f A schematic diagram illustrates the editing window for ABE-Umax tools. Editing preferences are indicated by a red shading gradient, with the darkest red marking the most preferred position and lighter shades representing less preferred edits. A blue line highlights the precise editing position. The red triangle denotes the theoretical SpCas9 cutting site, while the PAM sequence and its complement are shown in green. All source data in this figure are provided as a source data file. |
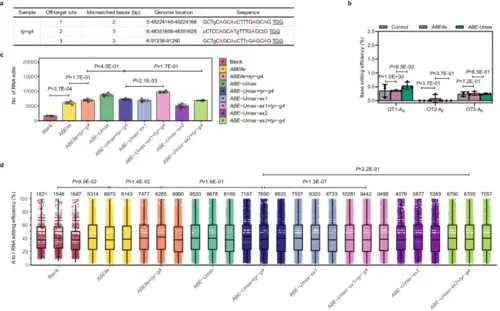
Off-target analysis of ABE-Umax-related tools in zebrafish. a Potential off-target sites at the tyr-g4 locus. The top three high-scoring off-target sites (PAM are underlined) are shown. Mismatched bases are indicated in lowercase, and the potentially editable A is highlighted in red. b DNA off-target comparison of ABE78e and ABE-Umax at the tyr-g4 locus. Editing efficiencies are displayed with error bars indicating mean ± s.d. (n = 3 biological replicates). Two-tailed paired t-test were performed (with P values marked). c Transcriptome analysis of edited adenine nucleotides in zebrafish embryos. Embryos were injected with ABE8e+tyr-g4, ABE-Umax-ex1+tyr-g4, ABE-UMax-ex2+tyr-g4, or their related mRNA only. Data from three independent replicates are shown. Two-tailed paired t-test were performed (with P values marked). d RNA A-to-I conversion frequencies in injected zebrafish embryos. Representative jitter plots display frequencies for embryos injected with ABE8e+tyr-g4, ABE-Umax-ex1+tyr-g4, ABE-UMax-ex2+tyr-g4, or their related mRNA only. The numbers of A-to-I RNA edits are indicated upon the plots. Data from three independent replicates are shown. All box plots include the median line, the box denotes the interquartile range (IQR), whiskers denote the rest of the data distribution and outliers are denoted by points greater than ±1.5 × IQR. Two-tailed paired t-test were performed (with P values marked). All source data in this figure are provided as a source data file. |
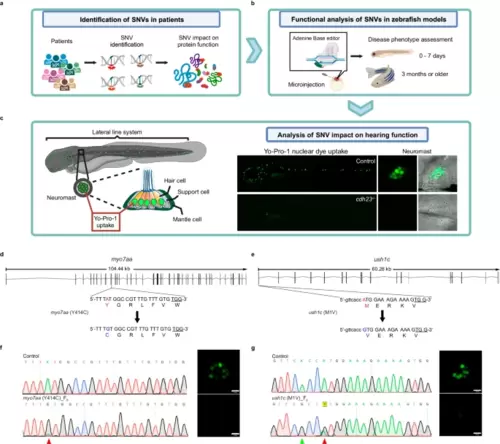
Functional analysis of VUS sites in F0 generation using ABE-Umax and its variants. a, b Overview of the variant functional analysis pipeline designed to test variants with unknown functions in the F0 generation at both larval and adult stages, using various morphological, cellular, and behavioral phenotypes. Created with BioRender.com released under a Creative Commons Attribution-NonCommercial-NoDerivs 4.0 International license. c Schematic of the zebrafish lateral line sensory system, which comprises clusters of mechanosensory hair cells known as neuromasts. Lateral line hair cells are functionally and molecularly similar to the hair cells found in the inner ear of zebrafish and serve as an excellent model for studying hearing function (left panel). A whole-mount live dye stain of hair cells using Yo-Pro1 dye, which is taken up by hair cell mechanotransduction channels. Control embryos display a green cluster of hair cells, whereas cdh23−/− mutants lack Yo-Pro1 positive hair cells, indicating the absence of functional hair cells. Created with BioRender.com released under a Creative Commons Attribution-NonCommercial-NoDerivs 4.0 International license. d, e Schematic diagrams of myo7aa (Y414C) and ush1c (M1V) in zebrafish. The targeted sequence is displayed with the PAM underlined. The targeted nucleotide and amino acid are highlighted in red, while the expected changes in nucleotide and amino acid are highlighted in blue. f, g Sequencing results and phenotypes of myo7aa (Y414C) F0 (e) and ush1c (M1V) F0 (f) induced by ABE-Umax. The red arrowhead points to the expected nucleotide substitutions, while a green arrowhead in the Sanger sequencing chromatograms indicates bystander base substitutions. Neuromast hair cells labeled with Yo-Pro1 (green) are displayed adjacent to the chromatograms. Three independent experiments were repeated with similar results. bars: 10 μm. |
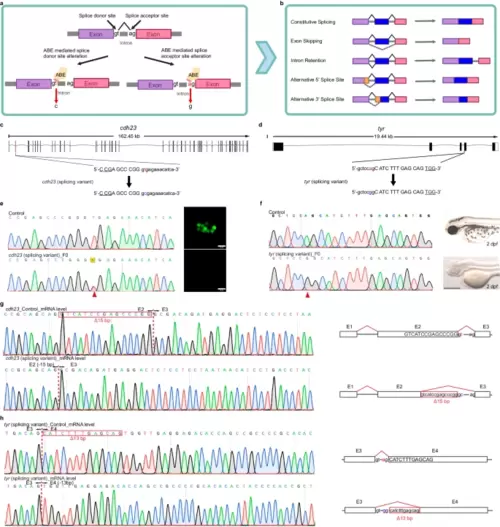
Editing of splice variants using ABE editors. a A schematic diagram of adenine base editing tools inducing splicing mutations. The colored bars (purple and pink) represent exons. Created with BioRender.com released under a Creative Commons Attribution-NonCommercial-NoDerivs 4.0 International license. b Overview of possible common alternative splicing events. The mechanisms of the most common alternative splicing events, which include Exon Skipping, Intron Retention, Alternative 5′ splice site selection, and Alternative 3′ Splice Site selection, are shown. The colored bars (purple, blue, and pink) represent exons. Yellow bars represent the alternatively spliced exons, while the gray lines connecting them represent intronic segments. Created with BioRender.com released under a Creative Commons Attribution-NonCommercial-NoDerivs 4.0 International license. c, d Schematic diagrams of the cdh23 (c) and tyr (d) splicing loci. The targeted sequence is displayed with the PAM underlined. The targeted nucleotides are highlighted in red, while the expected nucleotide changes are highlighted in blue. e Sequencing results and phenotype of the cdh23 splicing variant induced by ABE-Umax-ex2. The red arrowhead indicates the expected nucleotide substitutions. Neuromast hair cells labeled with Yo-Pro1 (green) are displayed adjacent to the chromatograms. Three independent experiments were repeated with similar results. Scale bars: 10 μm. f Sequencing results and phenotype of the tyr splicing variant induced by ABE-Umax. The red arrowhead indicates the expected nucleotide substitutions. Three independent experiments were repeated with similar results. Scale bars: 500 μm. g Sanger sequencing of cDNA demonstrates cdh23 splicing defects caused by ABE-Umax-ex2. The T-to-C substitution at the Exon 2 splicing donor site in cdh23 induces a 15 bp deletion at the mRNA level. The deletion sequence is highlighted in a red box. h Sanger sequencing reveals tyr splicing defects induced by ABE-Umax. The A-to-G substitution at the Exon 3 splicing acceptor site in tyr results in a 13 bp deletion at the mRNA level. The deletion sequence is highlighted in a red box. |
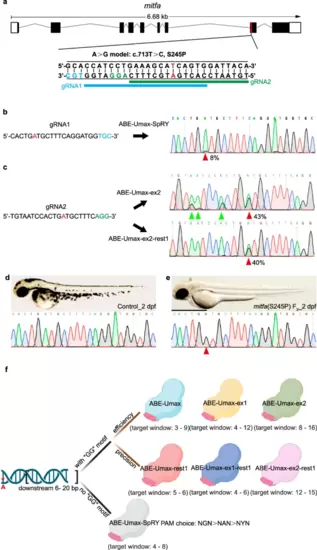
Disease modeling using ABE-Umax editors. a Generating A-to-G conversion in a disease-relevant zebrafish model (mitfa c.713 T > C). Protospacers are shown in black with PAM sequences in blue or green. The desired adenine for editing is highlighted in red. Potential gRNA target sites are marked with blue and green lines, respectively. b Sequencing results for mitfa (S245P) in ABE-Umax-SpRY-induced F0 generation. The desired adenine for editing is highlighted in red. Protospacers are shown in black with PAM sequences in blue. The red arrowhead indicates the expected nucleotide substitution. c Sequencing results for mitfa (S245P) in F0 generation induced by ABE-Umax-ex2 and ABE-Umax-ex2-rest1. The desired adenine for editing is highlighted in red. Protospacers are shown in black with PAM sequences in green. The red arrowhead indicates the expected nucleotide substitution. Bystander base substitutions are marked with green arrowheads in the Sanger sequencing chromatograms. d Lateral view of wild-type embryos at 2 dpf with sequencing results. Scale bar: 1 mm. e Lateral view of F2 homozygous embryos with the mitfa (S245P) mutation at 2 dpf, exhibiting pigmentation defects. The red arrowhead indicates the expected nucleotide substitution. Scale bar: 1 mm. f Selection of the right tool for A-to-G editing depends on the presence of a specific DNA sequence motif and can be selected as follows: Look for a GG motif within 6–20 base pairs downstream of the target adenine (red asterisks). Option 1: If a GG motif is present, (1) for high efficiency, consider ABE-Umax (window 3–9), ABE-Umax-ex1 (window 4–12), or ABE-Umax-ex2 (window 8–16); (2) for high precision, choose ABE-Umax-rest1 (window 5–6), ABE-Umax-ex1-rest1 (window 4–6), or ABE-Umax-ex2-rest1 (window 12–15). (3) If multiple tools meet your criteria, try them all to see which one works best. Option 2: If no GG motif is found, (1) use ABE-Umax-SpRY; (2) prioritize PAM sequences in this order: NGN > NAN > NYN; (3) position the edited adenine within the 4th–8th position of the editing window. The schematic diagrams in different colors represent different adenine-based editing tools. Created with BioRender.com released under a Creative Commons Attribution-NonCommercial-NoDerivs 4.0 International license. |