
Fig. 5
- ID
- ZDB-FIG-240708-17
- Publication
- Qin et al., 2024 - ABE-ultramax for high-efficiency biallelic adenine base editing in zebrafish
- Other Figures
- All Figure Page
- Back to All Figure Page
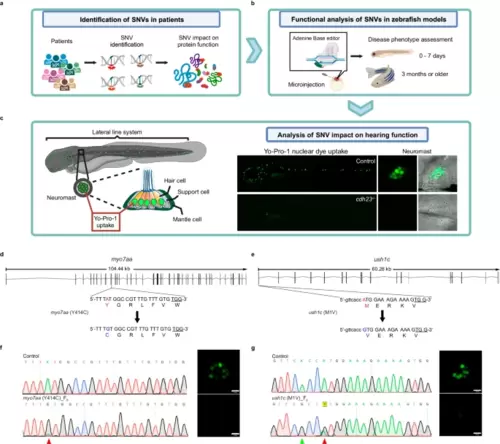
Functional analysis of VUS sites in F0 generation using ABE-Umax and its variants. a, b Overview of the variant functional analysis pipeline designed to test variants with unknown functions in the F0 generation at both larval and adult stages, using various morphological, cellular, and behavioral phenotypes. Created with BioRender.com released under a Creative Commons Attribution-NonCommercial-NoDerivs 4.0 International license. c Schematic of the zebrafish lateral line sensory system, which comprises clusters of mechanosensory hair cells known as neuromasts. Lateral line hair cells are functionally and molecularly similar to the hair cells found in the inner ear of zebrafish and serve as an excellent model for studying hearing function (left panel). A whole-mount live dye stain of hair cells using Yo-Pro1 dye, which is taken up by hair cell mechanotransduction channels. Control embryos display a green cluster of hair cells, whereas cdh23−/− mutants lack Yo-Pro1 positive hair cells, indicating the absence of functional hair cells. Created with BioRender.com released under a Creative Commons Attribution-NonCommercial-NoDerivs 4.0 International license. d, e Schematic diagrams of myo7aa (Y414C) and ush1c (M1V) in zebrafish. The targeted sequence is displayed with the PAM underlined. The targeted nucleotide and amino acid are highlighted in red, while the expected changes in nucleotide and amino acid are highlighted in blue. f, g Sequencing results and phenotypes of myo7aa (Y414C) F0 (e) and ush1c (M1V) F0 (f) induced by ABE-Umax. The red arrowhead points to the expected nucleotide substitutions, while a green arrowhead in the Sanger sequencing chromatograms indicates bystander base substitutions. Neuromast hair cells labeled with Yo-Pro1 (green) are displayed adjacent to the chromatograms. Three independent experiments were repeated with similar results. bars: 10 μm. |