
|
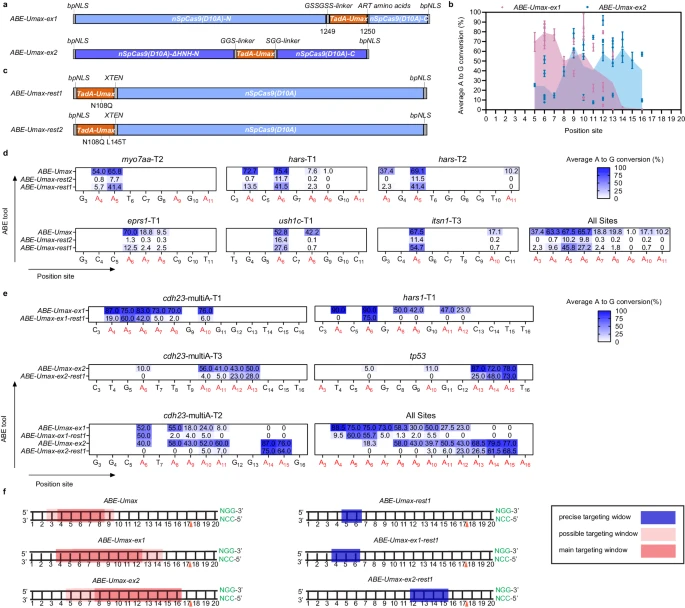
Fig. 3 Expanding editing windows for efficient and precise adenine base editing by ABE-Umax variants. a Schematics showing constructs of ABE-Umax-ex1 and ABE-Umax-ex2 designed to shift the editing window of adenine base editing. b Assessment of the efficiency and targeting window of ABE-Umax-ex1 and ABE-Umax-ex2. Each data point represents the average editing activity at a particular site. The targeting window of ABE-Umax-ex1 is colored in pink from position 5 to 14, and the targeting window of ABE-Umax-ex2 is colored in blue from position 5 to 16, counting from the 5’ terminal to the 3’ terminal of the targeting site. Data from three independent experiments were analyzed. c The schematics of ABE-Umax-rest1 and ABE-Umax-rest2 constructs for precise adenine base editing. d Examining A-to-G editing efficiency of ABE-Umax, ABE-Umax-rest2, and ABE-Umax-rest1 across six endogenous genomic loci. Miseq was used to quantify A-to-G conversion frequencies at each adenine nucleotide within the 20-bp protospacer sequences. Results from three independent experiments were compiled, with editing frequencies above 20% labeled in the heatmap. Color mapping (blue to white) represents editing efficiency from 100 to 0%. Editing base positions within the gRNA are indicated by numbers. e Evaluating the editing efficiency and targeting window of ABE-Umax-ex1-rest1 and ABE-Umax-ex2-rest1. EditR quantified A-to-G conversion frequencies at every adenine within the 20-bp protospacer. Data from three independent experiments were analyzed, with editing frequencies above 20% labeled in the heatmap. Color mapping (blue to white) indicates editing efficiency from 100% to 0%. Editing base positions within the gRNA are numerically labeled. f A schematic diagram illustrates the editing window for ABE-Umax tools. Editing preferences are indicated by a red shading gradient, with the darkest red marking the most preferred position and lighter shades representing less preferred edits. A blue line highlights the precise editing position. The red triangle denotes the theoretical SpCas9 cutting site, while the PAM sequence and its complement are shown in green. All source data in this figure are provided as a source data file.