
|
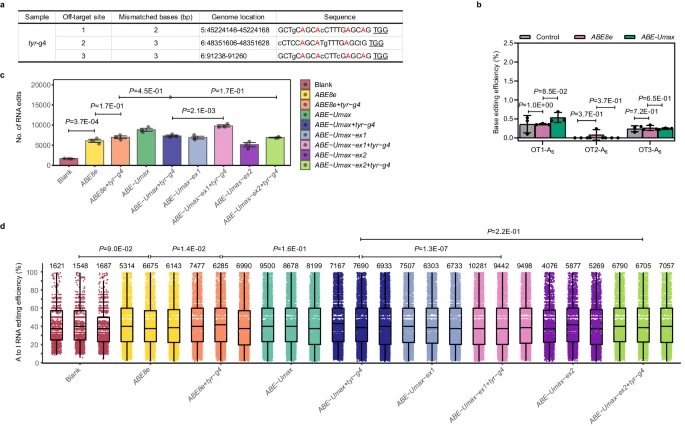
Fig. 4 Off-target analysis of ABE-Umax-related tools in zebrafish. a Potential off-target sites at the tyr-g4 locus. The top three high-scoring off-target sites (PAM are underlined) are shown. Mismatched bases are indicated in lowercase, and the potentially editable A is highlighted in red. b DNA off-target comparison of ABE78e and ABE-Umax at the tyr-g4 locus. Editing efficiencies are displayed with error bars indicating mean ± s.d. (n = 3 biological replicates). Two-tailed paired t-test were performed (with P values marked). c Transcriptome analysis of edited adenine nucleotides in zebrafish embryos. Embryos were injected with ABE8e+tyr-g4, ABE-Umax-ex1+tyr-g4, ABE-UMax-ex2+tyr-g4, or their related mRNA only. Data from three independent replicates are shown. Two-tailed paired t-test were performed (with P values marked). d RNA A-to-I conversion frequencies in injected zebrafish embryos. Representative jitter plots display frequencies for embryos injected with ABE8e+tyr-g4, ABE-Umax-ex1+tyr-g4, ABE-UMax-ex2+tyr-g4, or their related mRNA only. The numbers of A-to-I RNA edits are indicated upon the plots. Data from three independent replicates are shown. All box plots include the median line, the box denotes the interquartile range (IQR), whiskers denote the rest of the data distribution and outliers are denoted by points greater than ±1.5 × IQR. Two-tailed paired t-test were performed (with P values marked). All source data in this figure are provided as a source data file.