
|
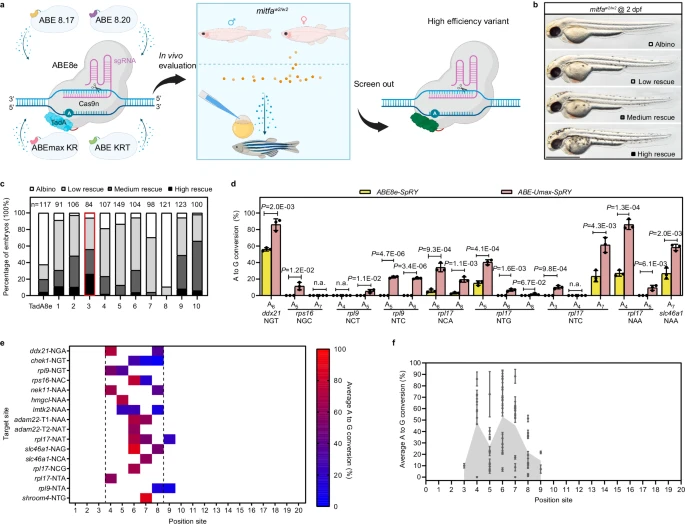
Fig. 1 Efficient adenine base editing mediated by ABE-Umax-SpRY. a Schematic diagram of the screening process for efficient adenine base editing tools. Cas9n Cas nickase, TadA adenine deaminase, PAM protospacer adjacent motif, sgRNA single guide RNA. Different colors (blue, yellow, purple, pink, and green) represent various TadA variants used in the deaminases. Created with BioRender.com released under a Creative Commons Attribution-NonCommercial-NoDerivs 4.0 International license. b Lateral views of embryos at 2 days post-fertilization (dpf) are displayed. The degree of mosaic pigmentation compared to the mutant is categorized. Scale bar: 1 mm. c A comparison of the efficiency of various adenine base editing tools in correcting point mutations in the mitfaW2/W2 mutant line. The stacked columns display the percentages of albino (white), low rescue (light gray), medium rescue (dark gray), and high rescue (black) embryos. The count of embryos is displayed above each column. The most efficient tool, ABE-Umax-SpRY, is highlighted in a red box. d Editing efficiency comparison between ABE8e-SpRY and ABE-Umax-SpRY using nine gRNAs targeting NNN PAMs. The edited base position within each gRNA is indicated by numbers. Data were presented as mean ± standard deviation (SD) calculated from three biological replicates. Two-tailed paired t-test were performed (with P values marked). e The heatmap illustrates the mean A-to-G editing efficiency of ABE-Umax-SpRY across 16 target sites at various positions within the protospacer. Editing efficiency (A-to-G conversion) is depicted using a color gradient, ranging from red (100%) to blue (0%). A-to-G conversion frequencies for each adenine nucleotide within the 20-bp protospacer were quantified using EditR. The heatmap displays conversion frequencies exceeding 0.20, averaged across three independent experiments. The black dotted line delineates ABE-Umax-SpRY’s preferred editing window, encompassing positions 4 through 8. f Assessment of the efficiency and targeting window of ABE-Umax-SpRY. Each data point represents the average editing activity ± standard deviation (SD) at a particular site based on the data in Fig. 1d, e. The targeting window of ABE-Umax-SpRY is colored in gray from position 3 to 9, counting from the 5′ terminal to the 3′ terminal of the targeting site. All source data in this figure are provided as a source data file.