FIGURE SUMMARY
Title

mTOR mutation disrupts larval zebrafish tail fin regeneration via regulating proliferation of blastema cells and mitochondrial functions

Authors
Xiao, G., Li, X., Yang, H., Zhang, R., Huang, J., Tian, Y., Nie, M., Sun, X.
Source
Full text @ J Orthop Surg Res

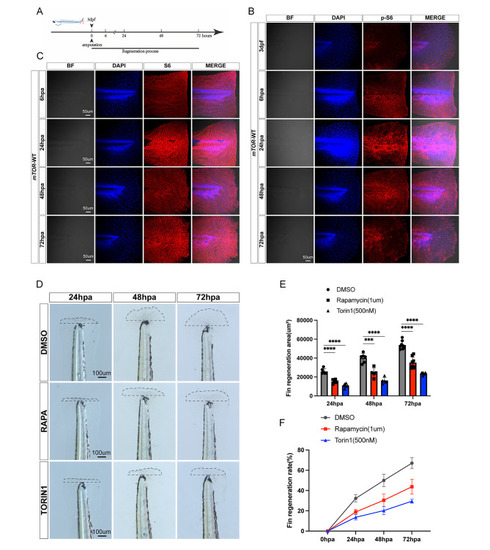
mTOR signaling was activated in larval zebrafish tail fin after amputation. (A) Fin amputation model: the tail fin was amputated at 3 dpf. (B) The expression level of p-S6 in mTOR-WT larval zebrafish fin at different stages after amputation. (C) The expression level of S6 in mTOR-WT larval zebrafish fin at different stages after amputation. (D) Effect of mTOR inhibitors (Rapamycin and Torin1) on larval zebrafish fin regeneration after amputation. (E-F) Statistical analysis of fin regeneration area and rate in mTOR-WT zebrafish larvae after administration of Rapamycin and Torin 1. ***P < 0.001, ****P < 0.0001

Construction of mTOR knock out zebrafish using CRISPR/Cas9 technology. (A) The gRNA targeted sequences in the exon 4 of mTOR gene. (B) Sanger sequencing results after injection of Cas9 mRNA. (C) DNA gel electrophoresis was used to detect PCR products. (D) Schematic diagram showing the screening of mTOR−/− fish line through Self-fertilization. (E-F) The fin area of un-amputated mTOR-WT and mTOR-KO zebrafish at 3 dpf. (G) Statistical analysis of p-S6/S6 between mTOR-WT and mTOR-KO larval zebrafish fin after amputation. (H) Effect of mTOR knock out on larval zebrafish fin regeneration after amputation. (I-J) Statistical analysis of fin regeneration area and rate after fin amputation between mTOR-WT and mTOR-KO zebrafish larvae. nsP > 0.05, ****P < 0.0001

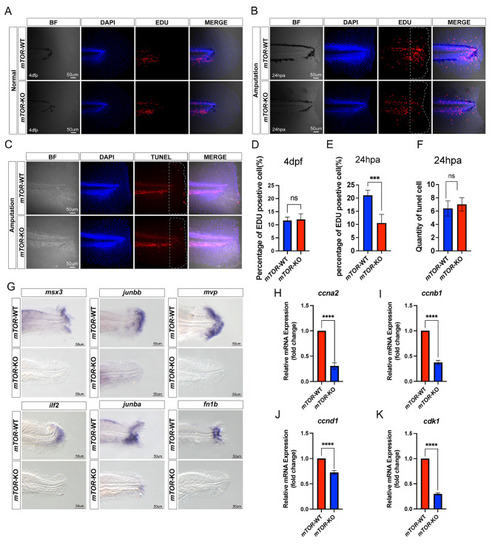
mTOR promoted epithelial and mesenchymal cells proliferation during larval zebrafish fin regeneration. (A, D) EDU staining of mTOR-WT and mTOR-KO larval zebrafish fin at 4 dpf. (B, E) EDU staining of mTOR-WT and mTOR-KO larval zebrafish fin at 24 hpa. (C, F) TUNEL staining of mTOR-WT and mTOR-KO larval zebrafish fin at 24hpa. (G) Location of msx3, junbb, mvp, ilf2, junba, fn1b in mTOR-WT and mTOR-KO larval zebrafish fin by in situ hybridization at 48 hpa. (H-K) The mRNA expression levels of cell cycle-related molecules (ccna2, ccnb1, ccnd1 and cdk1) between mTOR-WT and mTOR-KO larval zebrafish fin at 48 hpa. nsP > 0.05, ***P < 0.001, ****P < 0.0001

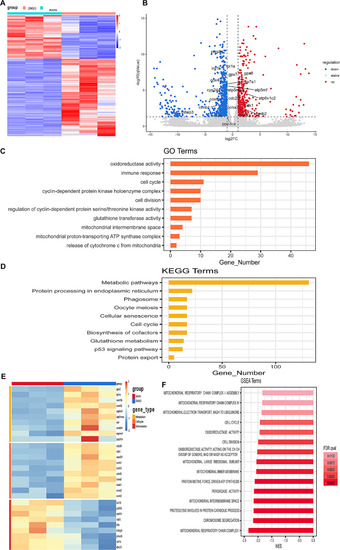
SMART-seq results of regenerated fins between mTOR-WT and rapamycin treated zebrafish larvae. (A) Heatmap of DEGs between mTOR-WT and rapamycin treated larval zebrafish tail fin. (B) Volcano map of DEGs between mTOR-WT and rapamycin treated larval zebrafish fin. (C) GO analysis of DEGs between the two groups. (D) KEGG pathway analysis of DEGs between the two groups. (E) Heatmap of metabolism, cell cycle and inflammation related genes between the two groups. (F) GSEA enrichment analysis of DEGs

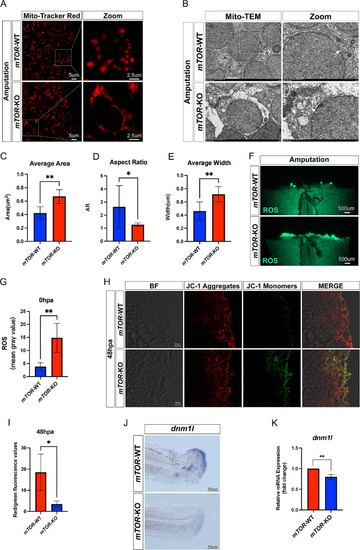
mTOR knock out affected mitochondrial morphology and membrane potential. (A) Mito-Tracker red staining of mTOR-WT and mTOR-KO larval zebrafish fin following amputation. (B) Representative transmission electron microscope images of mTOR-WT and mTOR-KO larval zebrafish fin after amputation. (C-E) Statistical analysis of the average area, aspect ratio and average width of mitochondria between mTOR-WT and mTOR-KO larval zebrafish fin after amputation. (F-G) The ROS levels between mTOR-WT and mTOR-KO larval zebrafish fin after amputation. (H-I) Measurement of the mitochondrial membrane potential by JC-1 staining between mTOR-WT and mTOR-KO zebrafish at 48 hpa. (J) Location of mitochondrial fission related gene (dnm1l) in mTOR-WT and mTOR-KO larval zebrafish fin by in situ hybridization. (K) mRNA expression level of dnm1l in mTOR-WT and mTOR-KO larval zebrafish fin. *P < 0.05, **P < 0.01

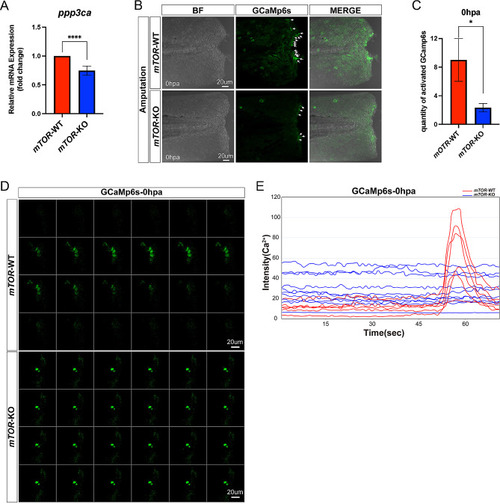
Ca2+ signaling was attenuated in mTOR-KO zebrafish larvae after fin amputation. (A) Comparison of mRNA expression level of ppp3ca between mTOR-WT and mTOR-KO larval zebrafish fin. (B-C) Analysis of Ca2+ signaling between mTOR-WT and mTOR-KO larval zebrafish fin after amputation. (D-E) Real-time in vivo images showing Ca2+ signaling between mTOR-WT and mTOR-KO larval zebrafish fin after amputation. *P > 0.05, ****P < 0.0001

Schematic illustration of the mechanism by which mTOR mutation disrupts larval zebrafish tail fin regeneration via regulating proliferation of blastema cells and mitochondrial functions

Acknowledgments
This image is the copyrighted work of the attributed author or publisher, and ZFIN has permission only to display this image to its users. Additional permissions should be obtained from the applicable author or publisher of the image. Full text @ J Orthop Surg Res