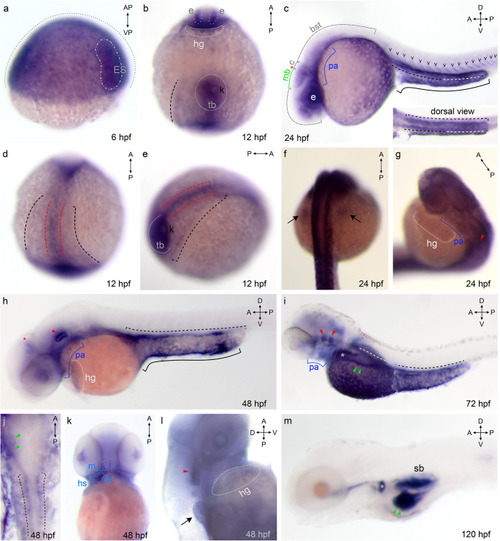
Increasingly more specific expression pattern of Gv suggests manifold roles during ontogenesis. Expression of Gv was examined by whole mount in situ hybridization in six developmental stages, 6, 12, 24, and 48 hpf (embryos), and 3 and 5 dpf (larvae). Organ abbreviations: bst, brain stem; c, cerebellum; ch, ceratohyal; e, eye; hg, hatching gland; ES, embryonic shield; hs, hyosymplectic; k, Kupffer’s vesicle; m, mandibular (Meckel’s + palatoquadrate); mb, midbrain; p.a., pharyngeal arches; sb, swim bladder; tb, tail bud. Symbols and line styles: white dotted line, hatching gland; white stippled/dotted line, hypoblast; red stippled line, notochord (axial mesoderm at 12 hpf); red asterisk, midbrain/hindbrain boundary; red arrow head, inner ear; green line, midbrain; green arrow head, gut; cyan stippled line, first and second pharyngeal arches (mandibular: Meckel’s cartilage and palatoquadrate and hyoid: ceratohyal and hyosymplectic); blue line, pharyngeal arches; gray dotted line, epiblast; gray asterisk, proximal convoluted tubule (PCT); black stippled line, pronephros (lateral plate mesoderm at 12 hpf); black line, yolk extension; black arrow, pectoral fin bud; black ‘v’, somites. For better visibility some lines are contrast adapted. a) 6 hpf; b), d), e) 12 hpf; d) dorsal view; e) dorsolateral view; c), f), g) 24 hpf; c) lateral view; f) dorsal view; g) dorsolateral view; h), j), k), l) 48 hpf; h) lateral view; j) dorsal view; k) ventral view; l) ventrolateral view; i) 72 hpf, lateral view; m) 120 hpf, lateral view

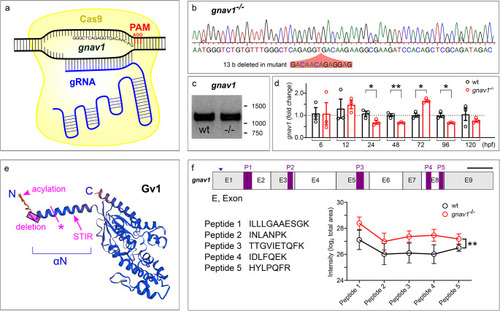
Knockout of zebrafish gnav1. (a) Schematic representation of knockout strategy using CRISPR/Cas9 method. The target sequence is shown. (b) Trace for homozygous knockout, with 13 b deletion indicated by red overlay in the nucleotide sequence. (c) RT-PCR for 5 dpf larvae shows presence of Gv RNA in the deletion mutant; 1% agarose TAE gel, stained with Midori green (NIPPON Genetics). (d) qPCR for Gv RNA in seven developmental stages. Wildtype (wt), black bars; deletion mutant, red bars. Significance estimated by two tailed unpaired t-test. *, p < 0.05; **, p < 0.01. y axis, fold change is normalized to reference genes rpl8 and rpl37. (e) Structure for Gv was taken from alphafold model AF-B0V3V7-F1-model_v4. The 13 b deletion is indicated by pink rectangle, it leads to a premature stop, pink asterisk. STIR, a potential secondary initiation site of translation. Acylation refers to two closely neighboring sites, for N-linked myristoylation and thio-palmitoylation (5). (f) Five peptides identified as suitable for parallel reaction mass spectrometry (PRM) are shown, together with their position in the exons of the gnav1 gene; the position of the deletion in exon 1 is indicated by arrowhead. Relative amounts present in 48 hpf larvae are shown for wildtype (black line) and deletion mutant (red line). Larvae are progeny of mutants and their wildtype siblings. The significance was determined with two-way ANOVA, **, p = 0.0055. Points represent mean+/-SEM of four independent determinations (each with a pool of 50 embryos)

EXPRESSION / LABELING:
Gene:
Fish:
Anatomical Term:
Stage Range: Shield to Day 5
PHENOTYPE:
Fish:
Observed In:
Stage Range: Prim-5 to Day 4

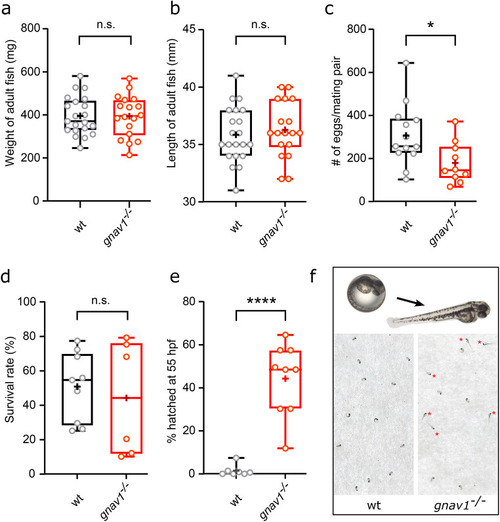
Reduced oviposition and premature hatching in Gv knockout. Wildtype, wt; gnav1 deletion mutant, gnav1−/−. Data for panels a) to e) are shown as whisker plots with quartile segments, mean values are indicated by crosses, individual measurements are shown as circles. (a) No difference in weight between 15 months adult wildtype and their homozygous gnav1 deletion mutant siblings. (b) No difference in body length between 15 months adult wildtype and their homozygous gnav1 deletion mutant siblings. (c) Clutch size (number of fertilised oocytes) is reduced in the homozygous gnav1 deletion mutant compared to their wildtype siblings exposed to the same mating schedule (9-month-old experienced breeding pairs, n = 10–13, p < 0.05). Unfertilized oocytes were rare. (d) No difference in survival rate at 24 hpf between wildtype and the homozygous gnav1 deletion mutant (sibling parents). After 1 dpf nearly no further death was observed for wildtype and mutant. (e) Hatching was evaluated early in the third day (54–56 hpf) and is faster in the homozygous gnav1 deletion mutant compared to wildtype (sibling parents) (p < 0.0001). Each circle represents a separate clutch. (f) Representative photographs of wildtype and gnav1 deletion mutant at 55 hpf, top pictures show a magnification for an unhatched embryo inside the chorion and a hatched fish. Red asterisks point out hatched larvae. Significance was estimated by two tailed unpaired t-test

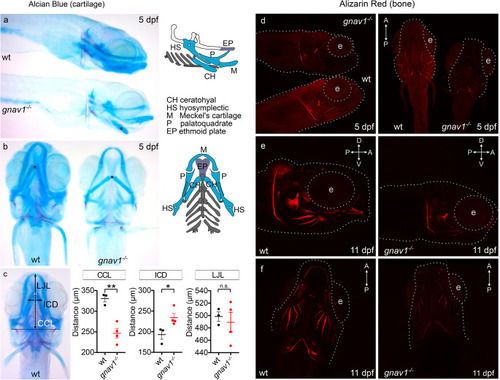
Craniofacial abnormalities in the gnav1 deletion mutant. Cartilage of wildtype (wt) and gnav1 deletion mutant (gnav1−/−) 5 dpf larvae (from sibling parents) was stained with Alcian Blue (panels a, b, c). Mineralization of bone structures was visualized with ARS fluorescence at 5 dpf (panel d) and 11 dpf (panels e, f). Note the clear reduction in staining intensity for the mutant for both dyes. (a) Lateral view, anterior is to the right, the scheme color-codes the cartilage visible in this orientation (scheme was modified from [25]. Asterisk, ceratohyal cartilages. Wildtype (wt) and mutant (gnav1−/−) were stained and photographed side by side. (b) Ventral view, anterior is up, the scheme color-codes the cartilage visible in this orientation (scheme was modified from [25]. Asterisk, ceratohyal cartilages. c) Left micrograph, definition of three axial distances, ceratohyal cartilage length, CCL; intercranial distance, ICD; lower jaw length, LJL. The quantitation for CCL, ICD and LJL shows mean, 1st and 3rd quartile as well as the individual data points for wildtype (black) and gnav1 deletion mutant (red). Significance estimated by two tailed unpaired t-test, *p < 0.05, **p < 0.01, and ns = not significant. Error bars denote SEM. d) 5 dpf larvae were stained and photographed side by side. Left micrograph, lateral view, anterior to the right; right micrograph, ventral view. Gray dotted lines outline head region and the eye (e). e), f), 11 dpf larvae needed to be photographed singly, due to size; exposure time identical for wildtype and mutant. e) 11 dpf larvae, lateral view, genotype as indicated. f) 11 dpf larvae, ventral view, genotype as indicated

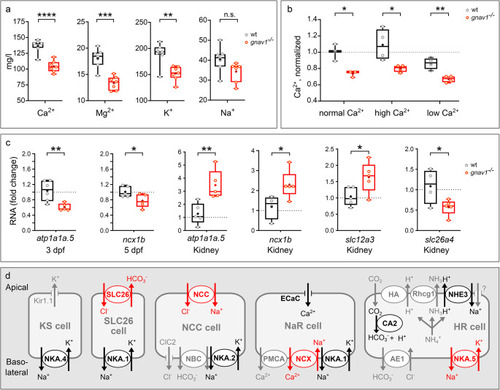
Decreased cation levels and altered ion transporter gene expression in Gv mutant zebrafish. Data for panels a) to c) are shown as whisker plots with quartile segments, mean values are indicated by crosses, individual measurements are shown as circles. (a) Cation levels were analysed by atomic absorption spectroscopy in pools of 25 larvae from sibling parents (5 dpf), n = 7 biological replicates. Note that all levels decrease in the mutant compared to wildtype (wt), three of them significantly. (b) A decrease in calcium levels in the mutant persists both in high and in low calcium rearing. Calcium levels are normalized to wildtype in normal calcium, n = 3–4 biological replicates. (c) qPCR of 3 dpf and 5 dpf larval pools (20 larvae, Gv mutant and wildtype from sibling parents) and adult kidneys of Gv mutants and their wildtype siblings showed altered gene expression as indicated, 4–5 biological replicates. Note that mutant adult kidney appeared phenotypically normal and showed no signs of edema. a, b, c) Significance was estimated by two tailed unpaired t-test: *, p < 0.05, **, p < 0.01, ***, p < 0.001; ****, p < 0.0001. (d) Current understanding of ion transporters, channels and exchangers in zebrafish ionocytes is depicted schematically (scheme modified from [27]. A largely overlapping set of genes is present in kidney [28]. Red ovals and arrows, significant alteration of expression was seen in the Gv mutant. Black ovals and arrows, no significant changes; gray ovals and arrows, not tested. Protein names are given, NKA.5 refers to gene atp1a1a.5; SLC26 refers to gene slc26a4; NCC refers to gene slc12a3, NCX refers to gene ncx1b

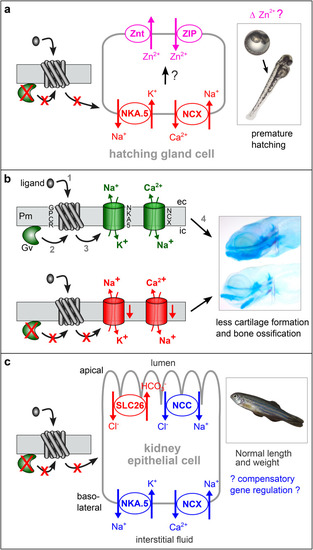
Hypotheses for Gv signalling pathways in three developmental stages. Arrows may represent several molecular steps. Red color indicates block (red crosses) or decrease in the mutant, blue depicts an increase, green represents wildtype levels, magenta shows hypothetical effect. (a) In the mutant embryo decreased levels of NKA.5 (Na+/K+ ATPase) and NCX (NCX1b) might secondarily influence Zn2+ levels in the hatching gland, possibly via two zinc transporters present in hatching gland cells [39], which would influence hatching enzyme activity, leading to premature hatching. (b) Top row shows wildtype situation: Gv is activated by so far unknown ligand/receptor pairs and eventually regulates NKA.5 and NCX expression, which is required for proper cartilage formation (upper zebrafish larva). Pm, plasma membrane; ec, extracellular; ic, intracellular; numbers refer to temporal order. Bottom row shows mutant situation, red crosses depict losses of the respective elements; red arrow, downregulation of expression of Na+/K+ ATPase and NCX may lead to reduced and distorted cartilage formation (lower zebrafish larva). Note that reduced calcium extrusion means less calcium getting inside the animal via the basal surface of ionocytes. For details of larval micrographs see Fig. 4b legend. (c) In the mutant adult kidney four ion transporters act to some extent compensatory: A decrease in SLC26 may be balanced by an increase in NCC for the chloride level, and sodium levels are reduced by increased NKA.5, but augmented by increased NCC and NCX. Such compensatory effects may explain the absence of outwardly visible phenotype in adult mutant zebrafish (framed inset)

ZFIN is incorporating published figure images and captions as part of an ongoing project. Figures from some publications have not yet been curated, or are not available for display because of copyright restrictions.

Unillustrated author statements

PHENOTYPE:
Fish:
Observed In:
Stage Range: Long-pec to Days 7-13
Acknowledgments
This image is the copyrighted work of the attributed author or publisher, and ZFIN has permission only to display this image to its users. Additional permissions should be obtained from the applicable author or publisher of the image. Full text @ Cell. Mol. Life Sci.