
|
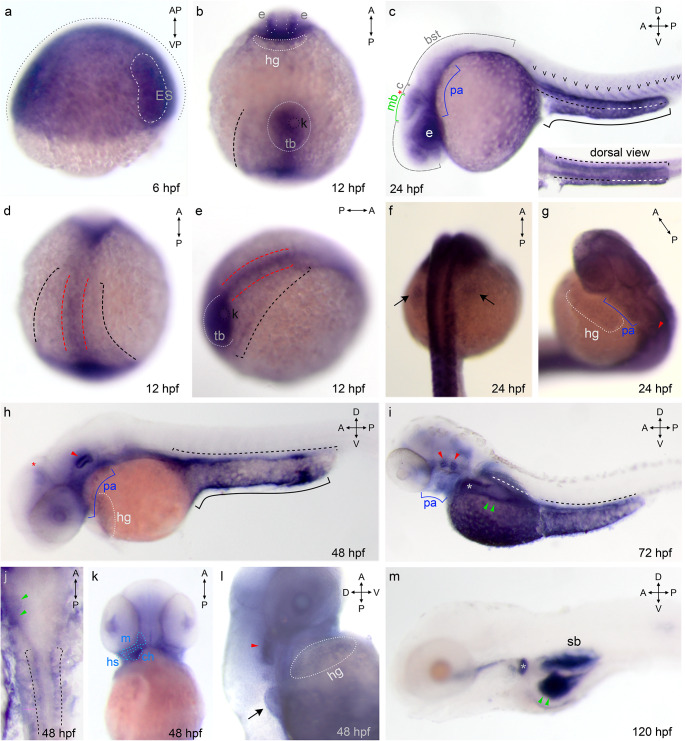
Fig. 1
Increasingly more specific expression pattern of Gv suggests manifold roles during ontogenesis. Expression of Gv was examined by whole mount in situ hybridization in six developmental stages, 6, 12, 24, and 48 hpf (embryos), and 3 and 5 dpf (larvae). Organ abbreviations: bst, brain stem; c, cerebellum; ch, ceratohyal; e, eye; hg, hatching gland; ES, embryonic shield; hs, hyosymplectic; k, Kupffer’s vesicle; m, mandibular (Meckel’s + palatoquadrate); mb, midbrain; p.a., pharyngeal arches; sb, swim bladder; tb, tail bud. Symbols and line styles: white dotted line, hatching gland; white stippled/dotted line, hypoblast; red stippled line, notochord (axial mesoderm at 12 hpf); red asterisk, midbrain/hindbrain boundary; red arrow head, inner ear; green line, midbrain; green arrow head, gut; cyan stippled line, first and second pharyngeal arches (mandibular: Meckel’s cartilage and palatoquadrate and hyoid: ceratohyal and hyosymplectic); blue line, pharyngeal arches; gray dotted line, epiblast; gray asterisk, proximal convoluted tubule (PCT); black stippled line, pronephros (lateral plate mesoderm at 12 hpf); black line, yolk extension; black arrow, pectoral fin bud; black ‘v’, somites. For better visibility some lines are contrast adapted.