
Fig. 2
- ID
- ZDB-IMAGE-240513-91
- Genes
- Publication
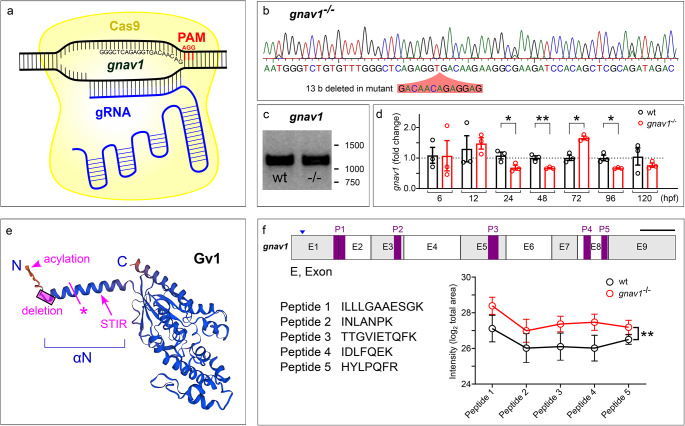
- Abu Obaid et al., 2024 - Deciphering the function of the fifth class of Gα proteins: regulation of ionic homeostasis as unifying hypothesis
- All Figures
- Figures for Abu Obaid et al., 2024
|
Fig. 2
Knockout of zebrafish gnav1. (