
- Title
-
Forward genetics combined with unsupervised classifications identified zebrafish mutants affecting biliary system formation
- Authors
- Singh, D.J., Tuscano, K.M., Ortega, A.L., Dimri, M., Tae, K., Lee, W., Muslim, M.A., Rivera Paz, I.M., Liu, J.L., Pierce, L.X., McClendon, A., Gibson, I., Livesay, J., Sakaguchi, T.F.
- Source
- Full text @ Dev. Biol.
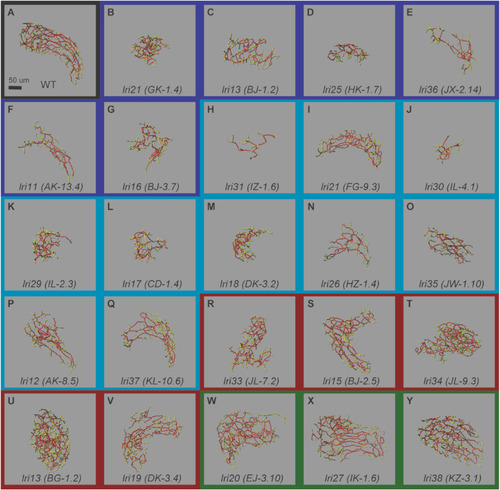
Skeletal representation of the intrahepatic biliary network at 5 dpf in mutants recovered from the forward genetic screen. Skeletal representation of the intrahepatic biliary network in mutant larvae based on Tg(Tp1-MmHbb:EGFP)um14 expression at 5 dpf, unbiasedly classified based on branching sub-parameters of the intrahepatic biliary network. (A) Wild-type control (Black border). (B–G) Class Ia (Dark Blue border): lri24 (GK-1.4) (B), lri14 (BJ-1.2) (C), lri25 (HK-1.7) (D), lri36 (JX-2.14) (E), lri11 (AK-13.4) (F), and lri16 (BJ-3.7) (G) mutants belong to this class. (H–Q) Class Ib (Light Blue border): lri31 (IZ-1.6) (H), lri21 (FG-9.3) (I), lri30 (IL-4.1) (J), lri29 (IL-2.3) (K), lri17 (CD-1.4) (L), lri18 (DK-3.2) (M), lri26 (HZ-1.4) (N), lri35 (JW-1.10) (O), lri12 (AK-8.5) (P), and lri37 (KL-10.6) (Q) mutants belong to this class. (R–V) Class II (Red border): lri33 (JL-7.2) (R), lri15 (BJ-2.5) (S), lri34 (JL-9.3) (T), lri13 (BG-1.2) (U), and lri19 (DK-3.4) (V) mutants belong to this class. (W–Y) Class III (Green border): lri20 (EJ-3.10) (W), lri27 (IK-1.6) (X), and lri38 (KZ-3.1) (Y) mutants belong to this class. Ventral views, anterior to the top. The network features are color-coded: end points (green), nodes (white), node-node connections (red), and node-end point connections (yellow). The representative biliary skeleton for each genotype was selected based on the lowest deviation from the average network structural sub-parameter attributes. |
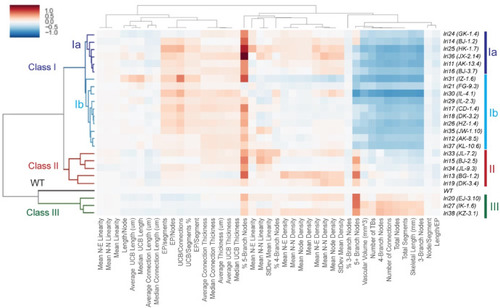
Clustered heat map-based classification of recovered mutants. Clustered heat map based on the structural sub-parameters of the intrahepatic biliary network in recovered mutant larvae at 5 dpf. All sub-parameters are normalized to the average value of the corresponding sub-parameters in the wild-type dataset. Clustering was done with the hierarchical clustering algorithm. Red indicates a higher value than wild-type, and blue indicates a lower value than wild-type. Values represent the average for each specimen dataset. The x-axis of the dendrogram indicates the relative similarity of each structural sub-parameter to other sub-parameters. The shorter the line between two sub-parameters, the more closely related they are. Similarly, the y-axis indicates the relative similarity of each mutant phenotype to other mutant phenotypes. Classes are denoted by the color of the y-axis dendrogram: Wild-type (Black), Class Ia (Dark Blue), Class Ib (Light Blue), Class II (Red), and Class III (Green). Classification was unbiasedly based on network structural sub-parameters of the intrahepatic biliary network. |

Principal component analysis (PCA) dimensionality reduction analysis-based mutant classification. (A) The PCA dimensionality reduction plot of wild-type and recovered mutants based on the mean values of biliary network structural sub-parameters within the allele indicates the similarity of phenotypes. Colors denote the defined class of that specimen group: Wild-type (Black), Class Ia (Dark Blue), Class Ib (Light Blue), Class II (Red), and Class III (Green). Proximity of the data points indicates the relative similarity of the recovered mutants; the closer the points, the more closely related the phenotypes are. (B) The PCA plot of all individual larvae of wild-type and recovered mutants analyzed in this study based on biliary network structural sub-parameters. The plot is labeled based on the assigned classes: Wild-type (Black), Class Ia (Dark Blue), Class Ib (Light Blue), Class II (Red), and Class III (Green). The same plots showing only the data from each class are shown separately. Each class of mutants was distributed in a pattern that partially overlapped but was still clearly distinct. |
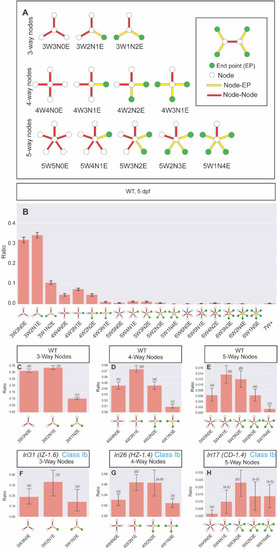
Defining the node-type composition of the intrahepatic biliary network. Computational network analysis revealed the intrahepatic biliary network could be defined as a combination of different types of nodes. (A) Schematics of node-subtypes existing in the intrahepatic biliary network. (B) Ratio of node sub-type distribution in the intrahepatic biliary network in wild-type larvae at 5 dpf. X-axis labels denote the number of branches connected to the node (#W), how many of those branches are node-node connections (#N), and how many of those branches are node-endpoint connections (#E). In the schematics, node (white circle), endpoint (green circle), node-node (red bar) and node-endpoint (yellow bar) connections indicate each node sub-type compositions. (C) Ratio of 3-way node sub-types in wild-type (WT) is plotted separately. The 3W2N1E node always exists significantly higher than the 3W1N2E node in WT. (D) Ratio of 4-way node sub-types in WT is plotted separately. Similar to the distribution of 3-way nodes, the 4W3N1E node always exists with the highest ratio in WT while the 4W1N3E node is always lower than other node sub-types. (E) Ratio of 5-way node sub-types in WT is plotted separately. The 5W1N4E node always exists at the lowest ratio in WT. (F) Ratio of 3-way node sub-types in lri31 (IZ-1.6) mutant larvae at 5 dpf. The ratio difference between 3W2N1E and 3W1N2E is lost in lri31 mutant larvae. (G) Ratio of 4-way node sub-types in lri26 (HZ-1.4) mutant larvae at 5 dpf. The relative ratio of the 4W1N3E node was increased in lri26 mutant larvae. (H) Ratio of 5-way node sub-types in lri17 (CD-1.4) mutant larvae at 5 dpf. The relative ratio of the 5W1N4E node is increased in lri17 mutant larvae. These data indicate the distribution of node sub-types is regulated in part by these mutations. Bars with a shared letter indicate the difference is not statistically significant. |
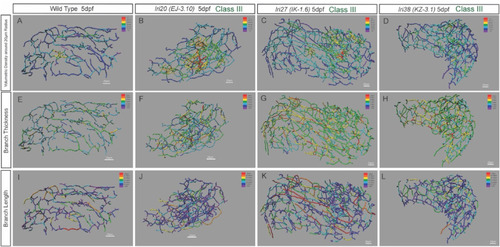
Heat map-based characterization of Class III mutant phenotypes. Heat map skeletal representation of the intrahepatic biliary network showing different segment properties in wild-type (WT) and recovered mutant larvae belonging to Class III. The colors of the heat maps indicate value ranges for each segment property. The hotter the color, the higher the value for all heat maps. (A–D) Network volumetric density heat map in WT (A), lri20 (EJ-3.10) (B), lri27 (IK-1.6) (C) and lri38 (KZ-3.1) (D) mutant larvae at 5 dpf. Purple represents less than 12 A.U., dark blue represents 12–24 A.U., light blue represents 24–36 A.U., green represents 36–48 A.U., yellow represents 48–60 A.U., orange represents 60–72 A.U., and red represents 72 A.U. and greater. These mutants show increased network density in a particular area in the liver not seen in WT. (E–H) Network connection thickness heat map in WT (E), lri20 (EJ-3.10) (F), lri27 (IK-1.6) (G) and lri38 (KZ-3.1) (H) mutant larvae at 5 dpf. Purple represents less than 1 μm, dark blue represents 1–2 μm, light blue represents 2–3 μm, green represents 3–4 μm, yellow represents 4–5 μm, orange represents 5–6 μm, and red represents 6 μm and greater. Network thickness increased uniformly across the entire network in the mutants compared to WT. (I–L) Network connection length heat map in WT (I), lri20 (EJ-3.10) (J), lri27 (IK-1.6) (K) and lri38 (KZ-3.1) (L) mutant larvae at 5 dpf. Purple represents less than 8 μm, dark blue represents 8–16 μm, light blue represents 16–24 μm, green represents 24–32 μm, yellow represents 32–40 μm, orange represents 40–48 μm, and red represents 48 μm and greater. Distribution of longer connections was only different from those in WT larvae in lri27 mutant larvae. |
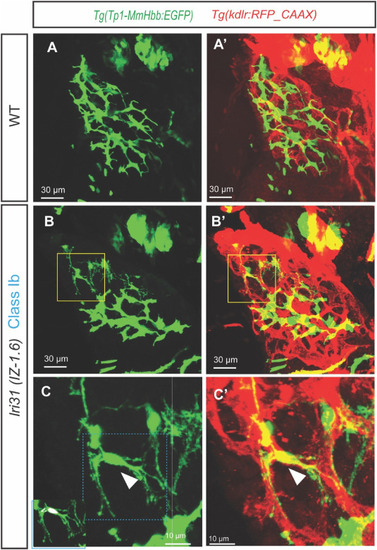
Biliary epithelial cells segregate from the intrahepatic biliary network in lri31 (IZ-1.6) mutant larvae at 5 dpf. (A–C) Projected confocal images of wild-type (A) and lri31 (IZ-1.6) mutant (B and C) larvae visualized for Tg(Tp1-MmHbb:EGFP)um14 expressions at 5 dpf. Tg(kdrl:RFP_CAAX)y171 expressions are merged in (A′-C′). Yellow-outlined area in B is magnified and shown in C. Blue-outlined area in C is magnified and merged with the DAPI and GFP co-localization signal in the left bottom corner. Ventral views, anterior to the top. In lri31 (IZ-1.6) mutant larvae, single biliary epithelial cells segregate from the intrahepatic biliary network and make physical contact with the intrahepatic vascular network (White arrowhead in C). DAPI and GFP co-localization assays revealed that six BECs are segregated from the main biliary tree in this larva. |
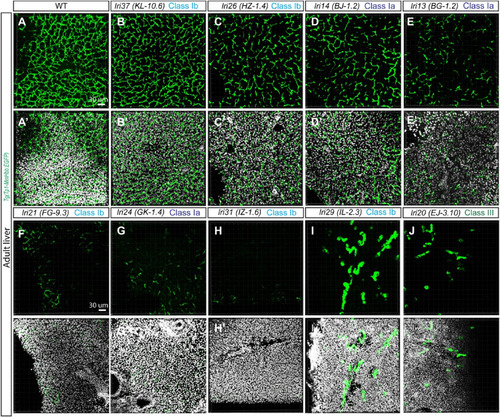
Recovered viable mutants show distinguishable phenotypes in the adult liver. (A-J) Projected confocal images of the adult liver visualized for Tg(Tp1-MmHbb:EGFP)um14 expression in wild-type (A), lri37 (KL-10.6) (B), lri26 (HZ-1.4) (C), lri14 (BJ-1.2) (D), lri13 (BG-1.2) (E), lri21 (FG-9.3) (F), lri24 (GK-1.4) (G), lri31 (IZ-1.6) (H), lri29 (IL-2.3) (I), and lri20 (EJ-3.10) (J) mutant fish. DAPI staining is overlaid in (A′-J′). Cross sections of the liver were used. The histology of the liver based on DAPI is significantly altered in lri21 (F′), lri24 (G′) and lri21 (J′), possibly due to cholestasis. The z-thickness of all projected images is 0.42 μm. |
Reprinted from Developmental Biology, 512, Singh, D.J., Tuscano, K.M., Ortega, A.L., Dimri, M., Tae, K., Lee, W., Muslim, M.A., Rivera Paz, I.M., Liu, J.L., Pierce, L.X., McClendon, A., Gibson, I., Livesay, J., Sakaguchi, T.F., Forward genetics combined with unsupervised classifications identified zebrafish mutants affecting biliary system formation, 44-56, Copyright (2024) with permission from Elsevier. Full text @ Dev. Biol.