
Fig. 4
- ID
- ZDB-FIG-240620-12
- Publication
- Singh et al., 2024 - Forward genetics combined with unsupervised classifications identified zebrafish mutants affecting biliary system formation
- Other Figures
- All Figure Page
- Back to All Figure Page
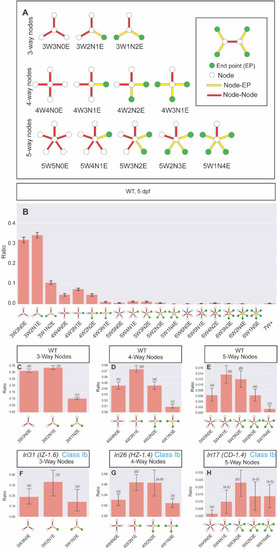
Defining the node-type composition of the intrahepatic biliary network. Computational network analysis revealed the intrahepatic biliary network could be defined as a combination of different types of nodes. (A) Schematics of node-subtypes existing in the intrahepatic biliary network. (B) Ratio of node sub-type distribution in the intrahepatic biliary network in wild-type larvae at 5 dpf. X-axis labels denote the number of branches connected to the node (#W), how many of those branches are node-node connections (#N), and how many of those branches are node-endpoint connections (#E). In the schematics, node (white circle), endpoint (green circle), node-node (red bar) and node-endpoint (yellow bar) connections indicate each node sub-type compositions. (C) Ratio of 3-way node sub-types in wild-type (WT) is plotted separately. The 3W2N1E node always exists significantly higher than the 3W1N2E node in WT. (D) Ratio of 4-way node sub-types in WT is plotted separately. Similar to the distribution of 3-way nodes, the 4W3N1E node always exists with the highest ratio in WT while the 4W1N3E node is always lower than other node sub-types. (E) Ratio of 5-way node sub-types in WT is plotted separately. The 5W1N4E node always exists at the lowest ratio in WT. (F) Ratio of 3-way node sub-types in lri31 (IZ-1.6) mutant larvae at 5 dpf. The ratio difference between 3W2N1E and 3W1N2E is lost in lri31 mutant larvae. (G) Ratio of 4-way node sub-types in lri26 (HZ-1.4) mutant larvae at 5 dpf. The relative ratio of the 4W1N3E node was increased in lri26 mutant larvae. (H) Ratio of 5-way node sub-types in lri17 (CD-1.4) mutant larvae at 5 dpf. The relative ratio of the 5W1N4E node is increased in lri17 mutant larvae. These data indicate the distribution of node sub-types is regulated in part by these mutations. Bars with a shared letter indicate the difference is not statistically significant. |
Reprinted from Developmental Biology, 512, Singh, D.J., Tuscano, K.M., Ortega, A.L., Dimri, M., Tae, K., Lee, W., Muslim, M.A., Rivera Paz, I.M., Liu, J.L., Pierce, L.X., McClendon, A., Gibson, I., Livesay, J., Sakaguchi, T.F., Forward genetics combined with unsupervised classifications identified zebrafish mutants affecting biliary system formation, 44-56, Copyright (2024) with permission from Elsevier. Full text @ Dev. Biol.