
Fig. 5
- ID
- ZDB-FIG-240620-13
- Publication
- Singh et al., 2024 - Forward genetics combined with unsupervised classifications identified zebrafish mutants affecting biliary system formation
- Other Figures
- All Figure Page
- Back to All Figure Page
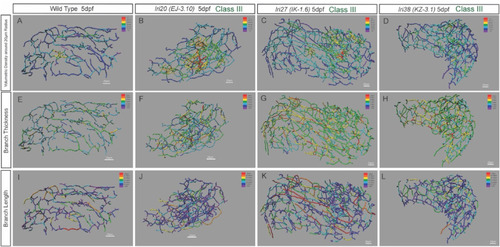
Heat map-based characterization of Class III mutant phenotypes. Heat map skeletal representation of the intrahepatic biliary network showing different segment properties in wild-type (WT) and recovered mutant larvae belonging to Class III. The colors of the heat maps indicate value ranges for each segment property. The hotter the color, the higher the value for all heat maps. (A–D) Network volumetric density heat map in WT (A), lri20 (EJ-3.10) (B), lri27 (IK-1.6) (C) and lri38 (KZ-3.1) (D) mutant larvae at 5 dpf. Purple represents less than 12 A.U., dark blue represents 12–24 A.U., light blue represents 24–36 A.U., green represents 36–48 A.U., yellow represents 48–60 A.U., orange represents 60–72 A.U., and red represents 72 A.U. and greater. These mutants show increased network density in a particular area in the liver not seen in WT. (E–H) Network connection thickness heat map in WT (E), lri20 (EJ-3.10) (F), lri27 (IK-1.6) (G) and lri38 (KZ-3.1) (H) mutant larvae at 5 dpf. Purple represents less than 1 μm, dark blue represents 1–2 μm, light blue represents 2–3 μm, green represents 3–4 μm, yellow represents 4–5 μm, orange represents 5–6 μm, and red represents 6 μm and greater. Network thickness increased uniformly across the entire network in the mutants compared to WT. (I–L) Network connection length heat map in WT (I), lri20 (EJ-3.10) (J), lri27 (IK-1.6) (K) and lri38 (KZ-3.1) (L) mutant larvae at 5 dpf. Purple represents less than 8 μm, dark blue represents 8–16 μm, light blue represents 16–24 μm, green represents 24–32 μm, yellow represents 32–40 μm, orange represents 40–48 μm, and red represents 48 μm and greater. Distribution of longer connections was only different from those in WT larvae in lri27 mutant larvae. |
Reprinted from Developmental Biology, 512, Singh, D.J., Tuscano, K.M., Ortega, A.L., Dimri, M., Tae, K., Lee, W., Muslim, M.A., Rivera Paz, I.M., Liu, J.L., Pierce, L.X., McClendon, A., Gibson, I., Livesay, J., Sakaguchi, T.F., Forward genetics combined with unsupervised classifications identified zebrafish mutants affecting biliary system formation, 44-56, Copyright (2024) with permission from Elsevier. Full text @ Dev. Biol.