
- Title
-
Cox7a1 controls skeletal muscle physiology and heart regeneration through complex IV dimerization
- Authors
- García-Poyatos, C., Arora, P., Calvo, E., Marques, I.J., Kirschke, N., Galardi-Castilla, M., Lembke, C., Meer, M., Fernández-Montes, P., Ernst, A., Haberthür, D., Hlushchuk, R., Vázquez, J., Vermathen, P., Enríquez, J.A., Mercader, N.
- Source
- Full text @ Dev. Cell
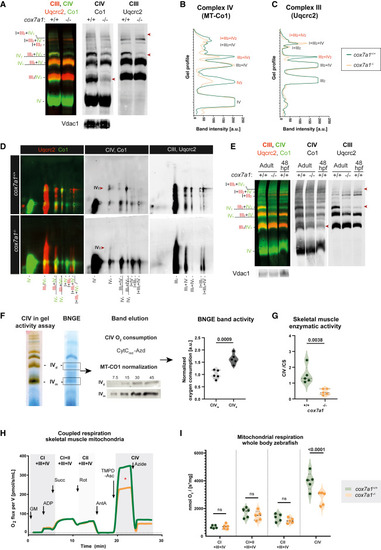
Cox7a1 stabilizes the dimerization of complex IV (A) BNGE and immunoblotting with the indicated antibodies of cox7a1+/+ and cox7a1−/− of whole zebrafish mitochondria. Shown are representative examples from a total of 3 technical replicates. Arrowheads mark regions where CIV complexes are missing. VDAC was used as loading control. (B and C) BNGE plot profile from CIV and CIII immunodetection with the indicated antibodies. (D) 2D BNGE digitonin-DDM and immunoblotting with the indicated antibodies of whole zebrafish mitochondria. Shown are representative examples from a total of 2 technical replicates. Arrowheads, missing CIV staining. (E) BNGE of adult cox7a1+/+ and cox7a1−/− whole body mitochondria (pool of n = 5 fish) and 48 hours post fertilization (hpf) deyolked wild-type embryos (pool of approximately 500 embryos; n = 1 technical replicate). Arrowheads, missing CIV complex. (F) BNGE band oxygen consumption rate normalized by complex IV sample content measured by MT-CO1 immunoblotting of CIV dimer (CIVd or CIV2) and monomer (CIVm or CIV1) of C57BL/6 mice heart mitochondria (n = 5 biological and technical replicates). Unpaired t test. (G) CIV enzymatic activity normalized by citrate synthase activity in skeletal muscle zebrafish mitochondria (n = 5 biological and technical replicates). Unpaired t test. (H) Oxygraphy of skeletal muscle mitochondria from zebrafish (n = 8 biological replicates, one technical replicate). Asterisk highlights changes between curves. (I) Oxygraphy of whole-body mitochondria from zebrafish (n = 5 biological and technical replicates). Genotypes were cox7a1−/− and wild-type sibling as explained in the legend. Two-way ANOVA. Ns, non-significant p > 0.05. |
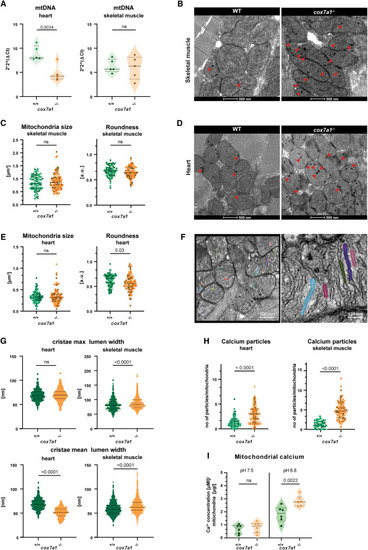
Reduced mitochondrial performance in cox7a1−/− zebrafish (A) mtDNA content assessed by quantitative PCR on 5 cox7a1−/− or wild-type sibling female hearts and skeletal muscle samples. Shown are median and quartiles, as well individual data points. Unpaired t test. ns, non-significant. (B–G) Transmission electron microscopy of skeletal muscle and heart from adult fish (n = 3 males per genotype). Arrowheads, calcium precipitates. (B) and (D) Representative images of skeletal and cardiac muscle mitochondria. (C) and (E) Measurement of mitochondrial size and roundness in skeletal muscle or heart. Unpaired t test. (F) Zoomed-in views of mitochondria to show segmented cristae lumen. (G) Measurement of maximal cristae lumen width and average cristae lumen width. On average ∼250 cristae were analyzed per biological replicate. Mann-Whitney U test. (H) Number of calcium particles per mitochondria in heart and skeletal muscle. A minimum of 30 mitochondria per biological sample were measured from 3 to 5 different regions of the section. Biological samples are represented with different color tones. Unpaired t test. (I) Calcium levels in fresh adult skeletal muscle isolated mitochondria subjected to pH 7.5 (basal dissolved calcium levels) and pH 6.8 (solubilization of calcium precipitates) (n = 6 male biological replicates per genotype). Shown are individual measurements as well as median and quartiles two-way ANOVA, and Fisher’s LSD multiple comparison. |
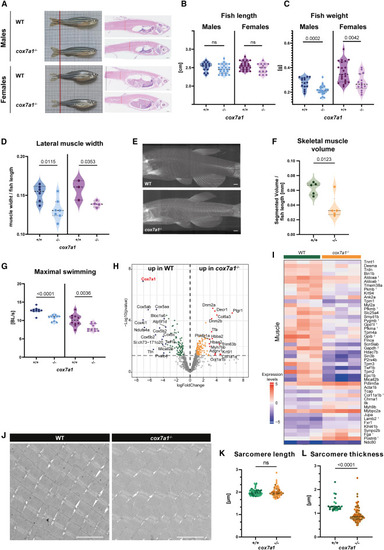
Reduced skeletal muscle mass of cox7a1−/− adult zebrafish (A) Representative pictures of male and female cox7a1+/+ and cox7a1−/− 5 months post fertilization (mpf) old zebrafish as well as sagittal histological. Hematoxylin and eosin-stained sections. Scale bars, 100μm. (B and C) Quantification of body length (B) and body weight (C) (n = 15–22, males, n = 22–14 females). Shown are values of individual animals as well as median and quartiles. Unpaired t test, ns, non-significant. (D) Lateral muscle width measured from samples shown in (A) (n = 6–7, males, n = 3–4 females). (E and F) μCT scans of a 5 mpf adult male zebrafish body. Maximum intensity projection images of two representative scans (E) and skeletal muscle volume segmented from 3D scans (F) (n = 5 biological replicates). Shown are values of individual measurements as well as median and quartiles; unpaired t test.Scale bars, 100μm. (G) Maximum swimming capacity represented by body length (BL) per second (n = 10). Shown are values of individual measurements as well as median and quartiles. Unpaired t test. (H and I) Quantitative proteomics of skeletal muscle comparing mutant and wild-type animals (pool of n = 5 biological samples per replicate, n = 3 technical replicates). (H) Volcano plot of detected proteins with log fold-change (LFC) > ±1 p value < 0.05. (I) Heatmap of proteins differentially expressed between cox7a1+/+ (wild-type [WT] siblings) and cox7a1−/− associated to the keyword “muscle.” Scale shows expression as normalized expression levels. Number indicates that proteins had been also associated to other analyzed pathways, as described in Data S1 . (J–L) Transmission electron microscopy of skeletal muscle sarcomeres (n = 3 males per genotype). Scale bars, 2 μm. (J) Representative images. (K) Quantification of sarcomere length and (L) sarcomere thickness. Data represented as median and quartiles. Individual measurements are indicated with color shade indicating different animals. t test, ns, non-significant. Scale bars, 2 μm. See also Data S1 and S2 . |
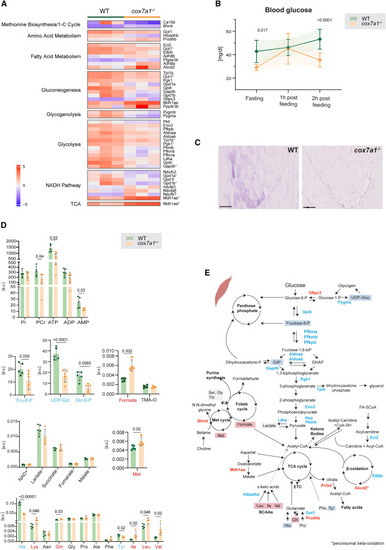
Metabolic changes in cox7a1−/− adult zebrafish skeletal muscle (A) Heatmap depicting proteins related to different metabolic pathways upregulated or downregulated in cox7a1−/− adult zebrafish skeletal muscle compared with wild-type siblings according to p value < 0.05 and a mean log fold-change (LFC) of ±1 (n = 3 replicates per group, each replicate consisting of a tissue pool from 5 animals). Scale reveals normalized expression levels. Proteins with superscripts 1 and 2 indicate that they were related to more than one pathway (2 or 3, respectively). Bar indicates expression levels. (B) Blood glucose levels in overnight fasting condition, 1 h post feeding, and 2 h post feeding (n = 10 males per genotype). Shown are mean ± SD. Two-way ANOVA, data point at 1 h post feeding, p = 0.988. (C) Representative image of skeletal muscle PAS staining in whole zebrafish paraffin sections (n = 10 both sexes per genotype). Scale bars, 100 μm. (D) Metabolites detected using NMR spectroscopy in cox7a1−/− adult zebrafish skeletal muscle compared with wild-type siblings (n = 5 biological replicates, males, and one technical replicate). Data represented as mean ± SD. Unpaired t test. a.u., arbitrary units; ppm, parts per million. (E) Schematic representation of metabolic pathways affected in cox7a1−/− adult zebrafish skeletal muscle. Significantly downregulated enzymes are shown in blue, and significantly upregulated enzymes are shown in red. Blue squares, significantly downregulated metabolites. Red squares, significantly upregulated metabolites. Gray squares, detected metabolites that remain constant in the compare conditions. PHENOTYPE:
|
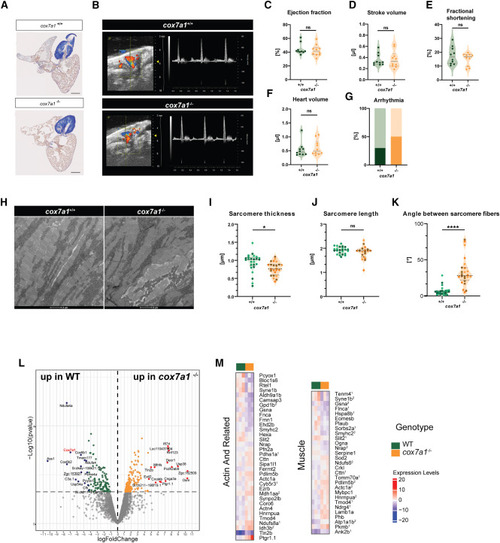
Mild alteration of the myocardium under homeostatic conditions in cox7a1−/− adult zebrafish (A) Representative section of acid fuchsin orange G (AFOG) staining of 5 months postfertilization (mpf) zebrafish hearts (n = 8). Scale bars, 250 μm. (B–G) Echocardiography of adult male cox7a1−/− fish. (B) Representative images of the recorded echocardiography of adult males (n = 10). (C) Percentage of ejection fraction, (D) stroke volume, (E), percentage of fractional shortening, (F) heart volume, (G) percentage of observed fish with arrythmias (dark colored bars). Shown are measurements of individual animals, median and quartiles. Unpaired t test. ns, non-significant. (H–K) Transmission electron microscopy images of adult heart section showing sarcomeres (shown are representative images of a total of n = 3 males per group). (H) Representative images, measurements of (I) sarcomere thickness, (J) sarcomere length, and (K) angle between sarcomeres. Sarcomeres were measured in 3–5 different areas per sample. Each biological replicate is represented in a different color tone. Shown are also median and quartiles. ns, non-significant. Unpaired t test. Scale bars, 2 μm. (L and M) Quantitative proteomics analysis comparing hearts from adult cox7a1−/− and wild-type zebrafish (n = 3 technical replicates; each being a pool of n = 5 biological samples from 5 mpf males). (L) Volcano plot of detected proteins with log fold-change (LFC) > ±1 p value < 0.05. (M) Heatmap of proteins differentially expressed between cox7a1+/+ (WT) and cox7a1−/− associated to the keywords “actin” and “muscle.” Scale shows expression as normalized expression levels. Numbers indicate proteins associated to other pathways (see Data S3 ). See also Data S3 and S4 . PHENOTYPE:
|
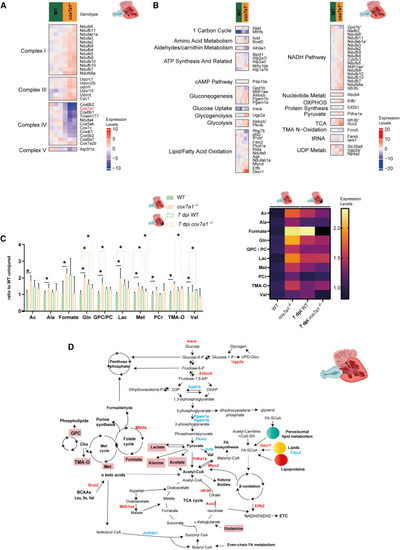
Metabolic rewiring in cox7a1−/− toward a pro-regenerative signature (A and B) Heatmap of proteins differentially expressed between cox7a1+/+ (WT) and cox7a1−/− associated to the mitochondrial respiratory chain (A) or different metabolic pathways (B) (p value < 0.05). Scale shows normalized expression levels. Numbers indicate that proteins had been also associated to other analyzed pathways, as described in Data S4 . (C) Metabolites detected by NMR spectroscopy in adult uninjured hearts or hearts collected 7 days postinjury (dpi). n = 3–5 technical replicates; each being a pool of n = 5 biological samples. ∗ p < 0.05. Graph shown on the left indicates mean and SD. Mean values are also shown as a heatmap (right). Scale indicates fold-change of each metabolite compared with uninjured wild-type (WT) control sibling. (D) Summary of observed metabolic rewiring. Red, enzymes/metabolites overexpressed or enriched in cox7a1−/− compared with uninjured control hearts. Blue, reduced enzymes/metabolites in cox7a1−/− compared with uninjured control hearts. PHENOTYPE:
|
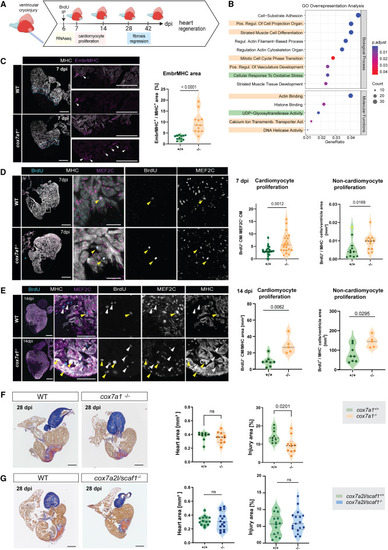
Improved heart regeneration in cox7a1−/− adult zebrafish (A) Schematic representation of experimental setup. Cardiac cryoinjury was performed on cox7a1−/− or wild-type siblings. Hearts were extracted at different days postinjury for transcriptomics analysis, immunostaining, or histological staining to assess changes in gene expression, cardiomyocyte proliferation, and fibrosis regression. Created with BioRender.com . (B) Gene Ontology pathway analysis of RNA sequencing of 7 dpi cox7a1−/− and wild-type ventricles. Highlighted pathways were enriched in up- (yellow) or downregulated (green) gene sets only. (C) Immunostaining of anti-embryonic MHC (embMHC) and anti-myosin heavy chain (MHC) on 7 dpi heart sections. Whole-heart and zoomed-in views of injury border zone as well as quantification of the percentage of cardiomyocyte area labeled by embryonic MHC in the 100 μm border zone (n = 12 per group). Arrowheads, embMHC-positive cells. Unpaired t test. (D) Cardiomyocyte proliferation at 7 dpi measured by BrdU injection at 6 dpi and immunostaining against the indicated antibodies. Representative images and quantification of BrdU+ cardiomyocytes normalized by the total number of cardiomyocyte nuclei MEF2C+ in the 100 μm border zone (unpaired t test) and number of non-cardiomyocytes per total area (Mann-Whitney test excluding the outlier highlighted in yellow) (n = 22–23 animals per group). Yellow arrowheads, BrdU+ cardiomyocytes (MEF2C, MHC+), white arrowheads, BrdU+ non-cardiomyocytes. (E) Cardiomyocyte proliferation at 14 dpi. BrdU injection was performed at 13 dpi, and immunostaining performed with indicated antibodies. Yellow arrowheads, BrdU+ cardiomyocytes (MEF2C, MHC+), and white arrowheads, BrdU+ non-cardiomyocytes. Quantification of BrdU+ cardiomyocytes normalized by the total MHC+ area (Mann-Whitney test). Non-cardiomyocyte proliferation was quantified by counting BrdU+ cells outside of the MHC+ area (Mann-Whitney test) (n = 5–8 animals per group). (F) AFOG staining of 28 dpi hearts (n = 9–11 and n = 7–8 animals per group, respectively). Representative images and graphs showing median values of total ventricle myocardium section area and percentage of injury area (collagen and fibrin staining) vs. total myocardium area of a total of at least 16 sections per heart. Data points are measurements from individual animals; shown are also median and quartiles. Heart area, Mann-Whitney test. ns, non-significant p = 0.4002. Injury area, unpaired t test. (G) Fibrosis regression in cryoinjured cox7a2l/scaf1−/− cardiac ventricles. AFOG staining of 28 dpi hearts from cox7a2l/scaf1−/− and wild-type siblings. Graph on the left, heart area. Shown are median values of a total of 5–10 sagittal sections per heart, as well as the median and quartiles of all values. Statistical test: Mann-Whitney. Graph on the right, percentage of injury area (collagen and fibrin staining) vs. total myocardium area. Shown are data points from individual animals as well as median and quartiles. Unpaired t test, ns, non-significant. In all images: Scale bars, 250 μm, whole heart sections, 100 μm zoom-ins. In all graphs of this figure, males are represented as circles and females as squares. dpi, days postinjury; MHC, myosin heavy chain. See also Data S5 , S6 , and S7 . EXPRESSION / LABELING:
PHENOTYPE:
|
Reprinted from Developmental Cell, 59(14), García-Poyatos, C., Arora, P., Calvo, E., Marques, I.J., Kirschke, N., Galardi-Castilla, M., Lembke, C., Meer, M., Fernández-Montes, P., Ernst, A., Haberthür, D., Hlushchuk, R., Vázquez, J., Vermathen, P., Enríquez, J.A., Mercader, N., Cox7a1 controls skeletal muscle physiology and heart regeneration through complex IV dimerization, 1824-1841.e10, Copyright (2024) with permission from Elsevier. Full text @ Dev. Cell