
Fig. 7
- ID
- ZDB-IMAGE-240725-51
- Antibodies
- Publication
- García-Poyatos et al., 2024 - Cox7a1 controls skeletal muscle physiology and heart regeneration through complex IV dimerization
- All Figures
- Figures for García-Poyatos et al., 2024
|
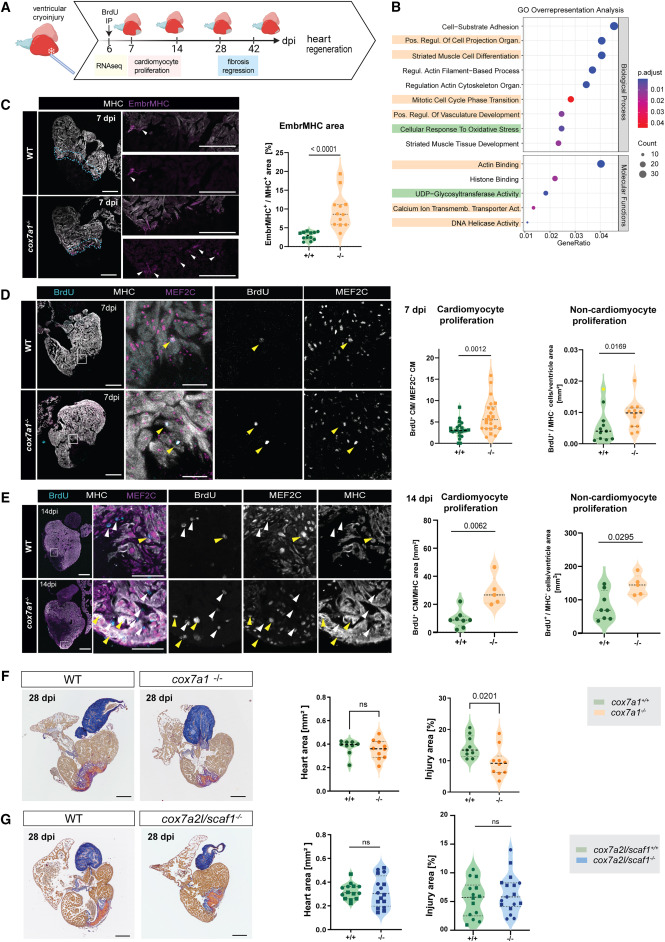
Fig. 7 Improved heart regeneration in cox7a1−/− adult zebrafish (A) Schematic representation of experimental setup. Cardiac cryoinjury was performed on cox7a1−/− or wild-type siblings. Hearts were extracted at different days postinjury for transcriptomics analysis, immunostaining, or histological staining to assess changes in gene expression, cardiomyocyte proliferation, and fibrosis regression. Created with BioRender.com . (B) Gene Ontology pathway analysis of RNA sequencing of 7 dpi cox7a1−/− and wild-type ventricles. Highlighted pathways were enriched in up- (yellow) or downregulated (green) gene sets only. (C) Immunostaining of anti-embryonic MHC (embMHC) and anti-myosin heavy chain (MHC) on 7 dpi heart sections. Whole-heart and zoomed-in views of injury border zone as well as quantification of the percentage of cardiomyocyte area labeled by embryonic MHC in the 100 μm border zone (n = 12 per group). Arrowheads, embMHC-positive cells. Unpaired t test. (D) Cardiomyocyte proliferation at 7 dpi measured by BrdU injection at 6 dpi and immunostaining against the indicated antibodies. Representative images and quantification of BrdU+ cardiomyocytes normalized by the total number of cardiomyocyte nuclei MEF2C+ in the 100 μm border zone (unpaired t test) and number of non-cardiomyocytes per total area (Mann-Whitney test excluding the outlier highlighted in yellow) (n = 22–23 animals per group). Yellow arrowheads, BrdU+ cardiomyocytes (MEF2C, MHC+), white arrowheads, BrdU+ non-cardiomyocytes. (E) Cardiomyocyte proliferation at 14 dpi. BrdU injection was performed at 13 dpi, and immunostaining performed with indicated antibodies. Yellow arrowheads, BrdU+ cardiomyocytes (MEF2C, MHC+), and white arrowheads, BrdU+ non-cardiomyocytes. Quantification of BrdU+ cardiomyocytes normalized by the total MHC+ area (Mann-Whitney test). Non-cardiomyocyte proliferation was quantified by counting BrdU+ cells outside of the MHC+ area (Mann-Whitney test) (n = 5–8 animals per group). (F) AFOG staining of 28 dpi hearts (n = 9–11 and n = 7–8 animals per group, respectively). Representative images and graphs showing median values of total ventricle myocardium section area and percentage of injury area (collagen and fibrin staining) vs. total myocardium area of a total of at least 16 sections per heart. Data points are measurements from individual animals; shown are also median and quartiles. Heart area, Mann-Whitney test. ns, non-significant p = 0.4002. Injury area, unpaired t test. (G) Fibrosis regression in cryoinjured cox7a2l/scaf1−/− cardiac ventricles. AFOG staining of 28 dpi hearts from cox7a2l/scaf1−/− and wild-type siblings. Graph on the left, heart area. Shown are median values of a total of 5–10 sagittal sections per heart, as well as the median and quartiles of all values. Statistical test: Mann-Whitney. Graph on the right, percentage of injury area (collagen and fibrin staining) vs. total myocardium area. Shown are data points from individual animals as well as median and quartiles. Unpaired t test, ns, non-significant. In all images: Scale bars, 250 μm, whole heart sections, 100 μm zoom-ins. In all graphs of this figure, males are represented as circles and females as squares. dpi, days postinjury; MHC, myosin heavy chain. See also Data S5 , S6 , and S7 .
Reprinted from Developmental Cell, 59(14), García-Poyatos, C., Arora, P., Calvo, E., Marques, I.J., Kirschke, N., Galardi-Castilla, M., Lembke, C., Meer, M., Fernández-Montes, P., Ernst, A., Haberthür, D., Hlushchuk, R., Vázquez, J., Vermathen, P., Enríquez, J.A., Mercader, N., Cox7a1 controls skeletal muscle physiology and heart regeneration through complex IV dimerization, 1824-1841.e10, Copyright (2024) with permission from Elsevier. Full text @ Dev. Cell