
Fig. 3
- ID
- ZDB-FIG-240725-47
- Publication
- García-Poyatos et al., 2024 - Cox7a1 controls skeletal muscle physiology and heart regeneration through complex IV dimerization
- Other Figures
- All Figure Page
- Back to All Figure Page
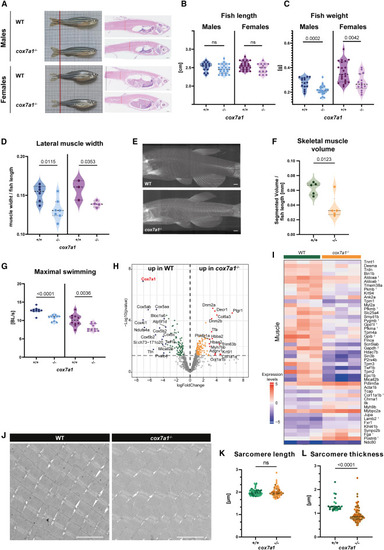
Reduced skeletal muscle mass of cox7a1−/− adult zebrafish (A) Representative pictures of male and female cox7a1+/+ and cox7a1−/− 5 months post fertilization (mpf) old zebrafish as well as sagittal histological. Hematoxylin and eosin-stained sections. Scale bars, 100μm. (B and C) Quantification of body length (B) and body weight (C) (n = 15–22, males, n = 22–14 females). Shown are values of individual animals as well as median and quartiles. Unpaired t test, ns, non-significant. (D) Lateral muscle width measured from samples shown in (A) (n = 6–7, males, n = 3–4 females). (E and F) μCT scans of a 5 mpf adult male zebrafish body. Maximum intensity projection images of two representative scans (E) and skeletal muscle volume segmented from 3D scans (F) (n = 5 biological replicates). Shown are values of individual measurements as well as median and quartiles; unpaired t test.Scale bars, 100μm. (G) Maximum swimming capacity represented by body length (BL) per second (n = 10). Shown are values of individual measurements as well as median and quartiles. Unpaired t test. (H and I) Quantitative proteomics of skeletal muscle comparing mutant and wild-type animals (pool of n = 5 biological samples per replicate, n = 3 technical replicates). (H) Volcano plot of detected proteins with log fold-change (LFC) > ±1 p value < 0.05. (I) Heatmap of proteins differentially expressed between cox7a1+/+ (wild-type [WT] siblings) and cox7a1−/− associated to the keyword “muscle.” Scale shows expression as normalized expression levels. Number indicates that proteins had been also associated to other analyzed pathways, as described in Data S1 . (J–L) Transmission electron microscopy of skeletal muscle sarcomeres (n = 3 males per genotype). Scale bars, 2 μm. (J) Representative images. (K) Quantification of sarcomere length and (L) sarcomere thickness. Data represented as median and quartiles. Individual measurements are indicated with color shade indicating different animals. t test, ns, non-significant. Scale bars, 2 μm. See also Data S1 and S2 . |
| Fish: | |
|---|---|
| Observed In: | |
| Stage: | Adult |
Reprinted from Developmental Cell, 59(14), García-Poyatos, C., Arora, P., Calvo, E., Marques, I.J., Kirschke, N., Galardi-Castilla, M., Lembke, C., Meer, M., Fernández-Montes, P., Ernst, A., Haberthür, D., Hlushchuk, R., Vázquez, J., Vermathen, P., Enríquez, J.A., Mercader, N., Cox7a1 controls skeletal muscle physiology and heart regeneration through complex IV dimerization, 1824-1841.e10, Copyright (2024) with permission from Elsevier. Full text @ Dev. Cell