FIGURE SUMMARY
Title

Microglia Mitigate Neuronal Activation in a Zebrafish Model of Dravet Syndrome

Authors
Brenet, A., Somkhit, J., Csaba, Z., Ciura, S., Kabashi, E., Yanicostas, C., Soussi-Yanicostas, N.
Source
Full text @ Cells

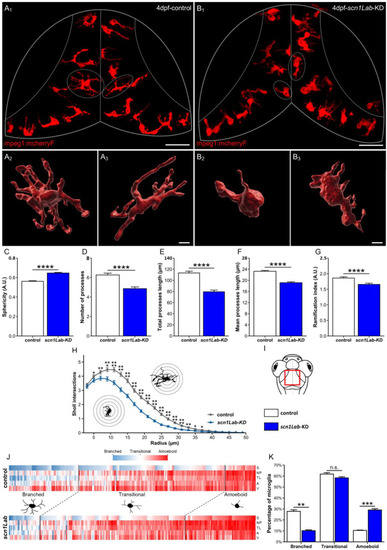
Microglia morphology parameters and clustering, in scn1Lab-KD larvae. (A,B) Dorsal views of the optic tectum of 4 dpf Tg[mpeg1:mCherryF] (A1) and Tg[mpeg1:mCherryF]; scn1Lab-KD (B2) larvae showing microglial cells, and 3D reconstructions of microglia in Tg[mpeg1:mCherryF] (A2,A3) and Tg[mpeg1:mCherryF]; scn1Lab-KD (B2,B3) individuals. (CG) Quantification of microglia sphericity (C), number of processes (D), total process length (E), mean process length (F), and ramification index (G), in 4 dpf Tg[mpeg1:mCherryF]; scn1Lab-KD (N = 11; n = 239) and Tg[mpeg1:mCherryF] larvae (N = 11; n = 228). (H) Sholl analysis of Tg[mpeg1:mCherryF] (black) and Tg[mpeg1:mCherryF]; scn1Lab-KD (blue) microglia branching. (I) Scheme of the head of a zebrafish larva with the area of interest (the periventricular stratum) framed in red. (J) Cluster analysis of microglia populations in 4 dpf Tg[mpeg1:mCherryF]; scn1Lab-KD larvae (N = 11; n = 239) and Tg[mpeg1:mCherryF] sibling controls (N = 11; n = 228), according to sphericity (S), number of processes (NP), total process length (TL), area (A), and volume (V), leading to three cell populations. (K) Repartition of control (white) and scn1Lab-KD (blue) microglia populations in the three clusters defined (“branched”, “amoeboid”, and “intermediate”). All data are represented as the mean ± sem. p-values were determined using Mann–Whitney or unpaired Student t-test depending on the normal distribution of the values. n.s., non-significant; *, p < 0.05; **, p < 0.01; ***, p < 0.001; ****, p < 0.0001. Scale bars: 50 µm (A1,B1); 10 µm (A2,A3,B2,B3).

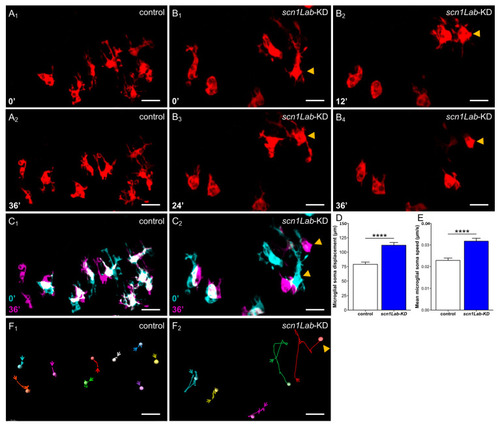
Microglia dynamics in scn1Lab-KD larvae. Confocal time-lapse analysis of microglia dynamics in the brains of 4 dpf not-injected Tg[mpeg1:mCherryF] control (A1,A2) and Tg[mpeg1:mCherryF]; scn1Lab-KD larvae (B1B4), and merged images of two-time points highlighting the increased move of microglia cell bodies in scn1Lab-KD larvae (C2) compared to that observed in WT controls during a 36-min period (C1) (0′: cyan, 36′: magenta, merge: white). Quantification of microglia cell body displacements (D) and mean displacement speed (E) over a 60-min period, in 4 dpf scn1Lab-KD larvae (N = 6; n = 55) and WT controls (N = 4; n = 46). (F) Microglial cell tracking over a 60-min period, in 4 dpf control (F1) and scn1Lab-KD (F2) larva brain. The scale bar is 20 µm in all images. N = number of larvae and n = number of microglial cells. All images were acquired with an SP8 Leica laser scanning confocal equipped with a 40×/water 1.1 objective. All data are represented as the mean ± sem. p-values were determined using the Mann–Whitney test. ****, p < 0.0001.

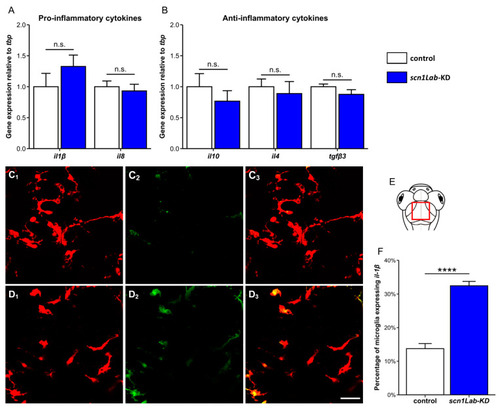
Cytokine expression in scn1Lab-KD larvae. (A,B) Quantification of the expression of genes encoding pro- (Il1β and Il8) (A), and anti-inflammatory cytokines (Il10, Il4, and Tgfβ3) (B), relative to that of the tbp gene, in the brains of 4 dpf not-injected (white) and scn1Lab-KD (blue) larvae. (C,D) Dorsal view of the periventricular stratum of 4 dpf Tg[mpeg1:mCherryF] (C1C3) and Tg[mpeg1:mCherryF]; scn1Lab-KD larvae (D1D3), showing Il1β-expressing microglial cells (C2,D2). Note that while part of “amoeboid” microglial cells only expressed the il1β:GFP transgene, few highly branched microglia also expressed il1β:GFP. (E) Scheme of a zebrafish larval head with the area of interest (the periventricular stratum) framed in red. (F) Quantification of the percentage of microglial cells expressing Il1β:GFP in not-injected (N = 19) and scn1Lab-KD larvae (N = 16). Scale: 10 µm. N = number of larvae analyzed. All images were acquired using a Leica SP8 confocal microscope, equipped with a 20×/water objective with a numerical aperture of 0.75. All graphs represent mean ± sem. The p-values were calculated using a Student’s t-test. n.s., not significant; ****, p < 0.0001.

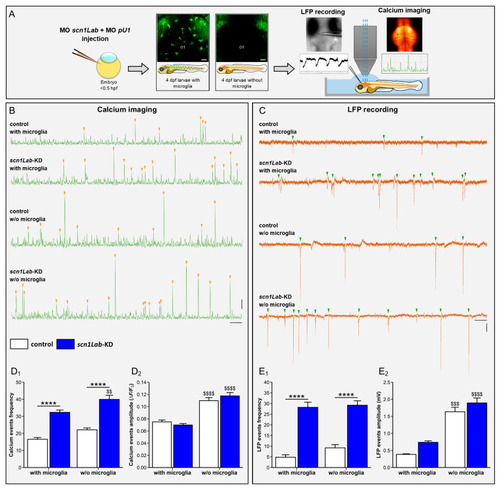
Microglia depletion increases neuron hyperactivity in scn1Lab-KD larvae. (A) Scheme of the experimental setup. (B) Calcium imaging of Ca++ uptake events recorded over a 20-min period in 4 dpf WT (N = 11), scn1Lab-KD (N = 16), microglia-depleted WT (N = 9) and microglia-depleted scn1Lab-KD larvae (N = 9). (C) LFP recording over a 20-min period of neuron activity in 4 dpf WT (N = 5), scn1Lab-KD (N = 5), microglia-depleted WT (N = 5) and microglia-depleted scn1Lab-KD larvae (N = 5). Scale bars of calcium traces: 0.05 ΔF/F0 and 1 min; and that of LFP traces: 0.5 mV and 1 min. Quantification of the frequency (D1) and amplitude (D2) of calcium events with intensity > 0.04 ΔF/F0, recorded during a 1-h period in 4 dpf not-injected (white) and scn1Lab-KD larvae (blue). (E). Quantification of the frequency (E1) and amplitude (E2) of LFP traces with downwards depolarization > 0.3 mV and lasting > 100 ms, recorded during a 1-h period in 4 dpf not injected (white) and scn1Lab-KD larvae (blue). N = number of larvae. All data are represented as the mean ± sem. ****, p < 0.0001: indicates a statistically significant difference between control and scn1Lab-KD larvae. $$, p < 0.01; $$$, p < 0.001; $$$$, p < 0.0001: indicates a statistically significant difference between larvae with or without microglia. p-values were determined using two-way ANOVA with Tukey post-tests.

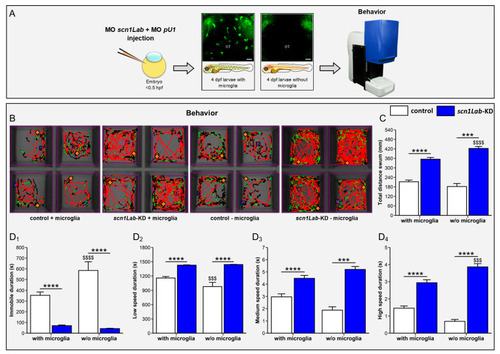
Microglia ablation increases the locomotor activity of scn1Lab-KD larvae. (A) Scheme of the experimental setup. (B) Traces of the moves of WT (N = 148), scn1Lab-KD (N = 184), microglia-depleted WT (N = 45), and microglia-depleted scn1Lab-KD larvae (N = 28). The swimming speeds of larvae are represented according to the following color codes: black (low speed), green (medium speed), and red (high speed). (C) Quantification of the total distance traveled by 4 dpf WT (white) and scn1Lab-KD larvae (blue) during a 30-min period recording. (D) Quantification of the time spent by 4 dpf WT (white) and scn1Lab-KD larvae (blue) in a motionless position (D1), or swimming at low (D2), medium (D3), and high speed (D4). N = number of larvae. All graphs represent the average ± sem. The p-values were calculated by a two-way ANOVA followed by a Tukey post-test. ***, p < 0.001; ****, p < 0.0001: indicates a statistical difference between genotypes. $$$, p < 0.001; $$$$, p < 0.0001: indicate significant differences depending on the presence or absence of microglia.

Acknowledgments
This image is the copyrighted work of the attributed author or publisher, and ZFIN has permission only to display this image to its users. Additional permissions should be obtained from the applicable author or publisher of the image. Full text @ Cells