FIGURE

Figure 2

ID
ZDB-FIG-240429-30
Publication
Brenet et al., 2024 - Microglia Mitigate Neuronal Activation in a Zebrafish Model of Dravet Syndrome
Other Figures
All Figure Page
Back to All Figure Page
Figure 2

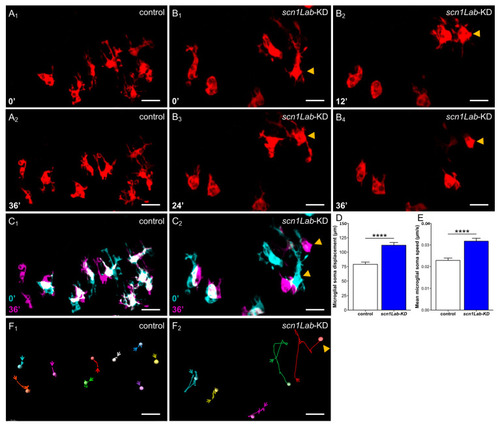
Microglia dynamics in scn1Lab-KD larvae. Confocal time-lapse analysis of microglia dynamics in the brains of 4 dpf not-injected Tg[mpeg1:mCherryF] control (A1,A2) and Tg[mpeg1:mCherryF]; scn1Lab-KD larvae (B1B4), and merged images of two-time points highlighting the increased move of microglia cell bodies in scn1Lab-KD larvae (C2) compared to that observed in WT controls during a 36-min period (C1) (0′: cyan, 36′: magenta, merge: white). Quantification of microglia cell body displacements (D) and mean displacement speed (E) over a 60-min period, in 4 dpf scn1Lab-KD larvae (N = 6; n = 55) and WT controls (N = 4; n = 46). (F) Microglial cell tracking over a 60-min period, in 4 dpf control (F1) and scn1Lab-KD (F2) larva brain. The scale bar is 20 µm in all images. N = number of larvae and n = number of microglial cells. All images were acquired with an SP8 Leica laser scanning confocal equipped with a 40×/water 1.1 objective. All data are represented as the mean ± sem. p-values were determined using the Mann–Whitney test. ****, p < 0.0001.

Expression Data

Expression Detail
Antibody Labeling
Phenotype Data

Phenotype Detail
Acknowledgments
This image is the copyrighted work of the attributed author or publisher, and ZFIN has permission only to display this image to its users. Additional permissions should be obtained from the applicable author or publisher of the image. Full text @ Cells