IMAGE

Figure 5

ID
ZDB-IMAGE-240429-36
Source
Figures for Brenet et al., 2024
Image
Figure Caption

Figure 5

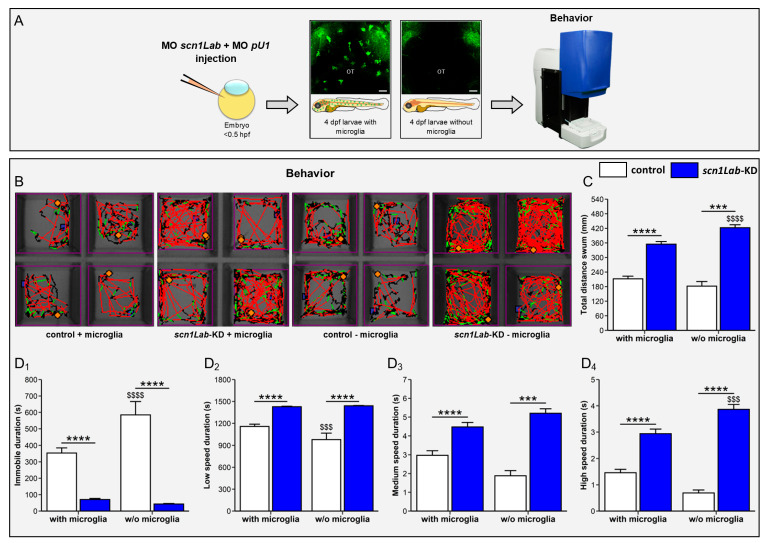
Microglia ablation increases the locomotor activity of scn1Lab-KD larvae. (A) Scheme of the experimental setup. (B) Traces of the moves of WT (N = 148), scn1Lab-KD (N = 184), microglia-depleted WT (N = 45), and microglia-depleted scn1Lab-KD larvae (N = 28). The swimming speeds of larvae are represented according to the following color codes: black (low speed), green (medium speed), and red (high speed). (C) Quantification of the total distance traveled by 4 dpf WT (white) and scn1Lab-KD larvae (blue) during a 30-min period recording. (D) Quantification of the time spent by 4 dpf WT (white) and scn1Lab-KD larvae (blue) in a motionless position (D1), or swimming at low (D2), medium (D3), and high speed (D4). N = number of larvae. All graphs represent the average ± sem. The p-values were calculated by a two-way ANOVA followed by a Tukey post-test. ***, p < 0.001; ****, p < 0.0001: indicates a statistical difference between genotypes. $$$, p < 0.001; $$$$, p < 0.0001: indicate significant differences depending on the presence or absence of microglia.

Acknowledgments
This image is the copyrighted work of the attributed author or publisher, and ZFIN has permission only to display this image to its users. Additional permissions should be obtained from the applicable author or publisher of the image. Full text @ Cells