
Figure 1
- ID
- ZDB-IMAGE-240429-31
- Genes
- Publication
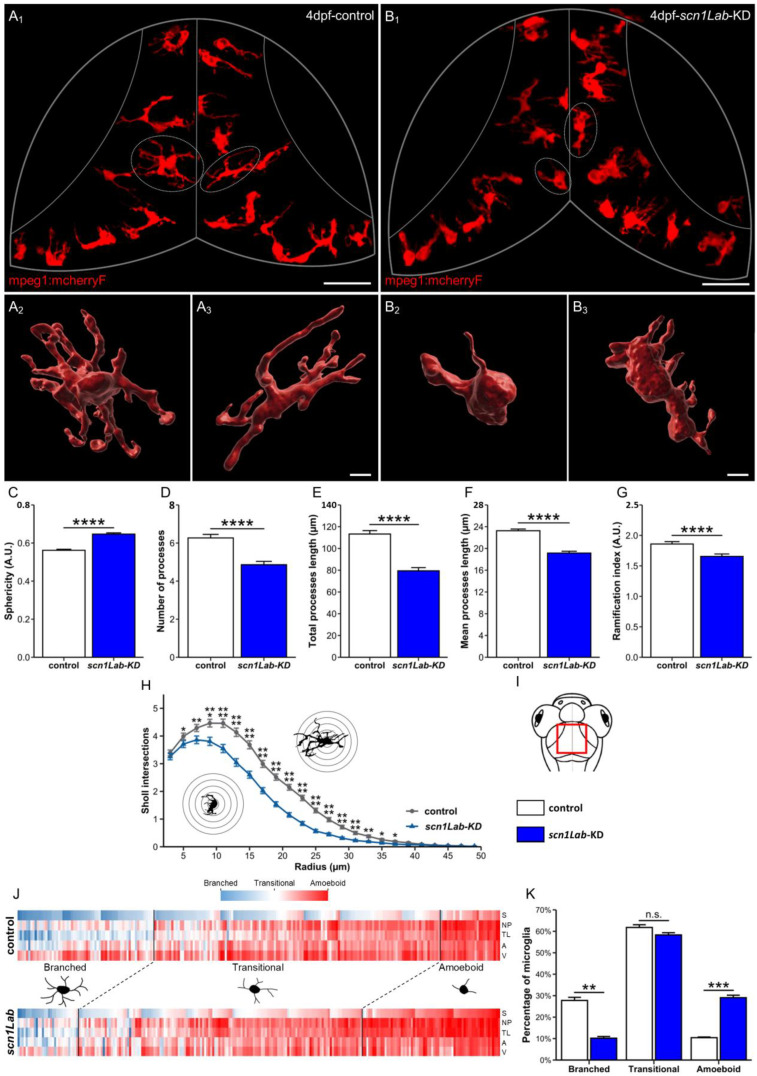
- Brenet et al., 2024 - Microglia Mitigate Neuronal Activation in a Zebrafish Model of Dravet Syndrome
- All Figures
- Figures for Brenet et al., 2024
|
Figure 1
Microglia morphology parameters and clustering, in