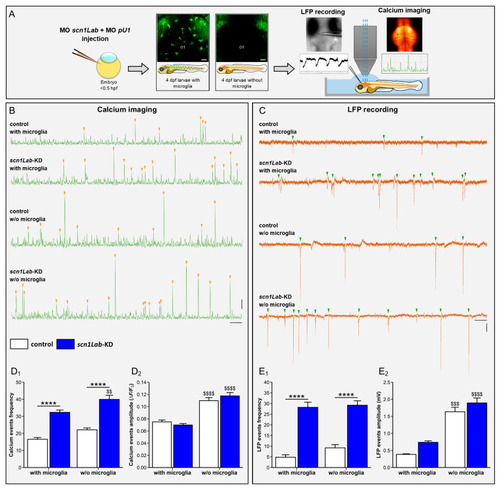
Microglia depletion increases neuron hyperactivity in scn1Lab-KD larvae. (A) Scheme of the experimental setup. (B) Calcium imaging of Ca++ uptake events recorded over a 20-min period in 4 dpf WT (N = 11), scn1Lab-KD (N = 16), microglia-depleted WT (N = 9) and microglia-depleted scn1Lab-KD larvae (N = 9). (C) LFP recording over a 20-min period of neuron activity in 4 dpf WT (N = 5), scn1Lab-KD (N = 5), microglia-depleted WT (N = 5) and microglia-depleted scn1Lab-KD larvae (N = 5). Scale bars of calcium traces: 0.05 ΔF/F0 and 1 min; and that of LFP traces: 0.5 mV and 1 min. Quantification of the frequency (D1) and amplitude (D2) of calcium events with intensity > 0.04 ΔF/F0, recorded during a 1-h period in 4 dpf not-injected (white) and scn1Lab-KD larvae (blue). (E). Quantification of the frequency (E1) and amplitude (E2) of LFP traces with downwards depolarization > 0.3 mV and lasting > 100 ms, recorded during a 1-h period in 4 dpf not injected (white) and scn1Lab-KD larvae (blue). N = number of larvae. All data are represented as the mean ± sem. ****, p < 0.0001: indicates a statistically significant difference between control and scn1Lab-KD larvae. $$, p < 0.01; $$$, p < 0.001; $$$$, p < 0.0001: indicates a statistically significant difference between larvae with or without microglia. p-values were determined using two-way ANOVA with Tukey post-tests.
|
