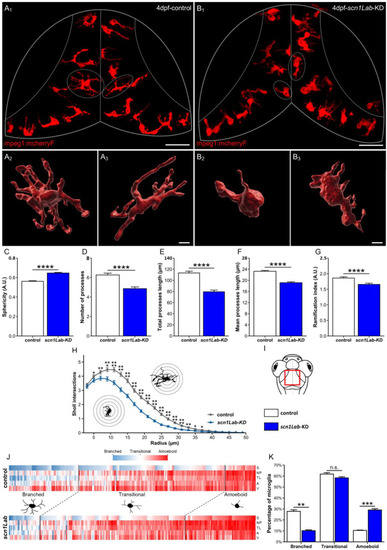
Microglia morphology parameters and clustering, in scn1Lab-KD larvae. (A,B) Dorsal views of the optic tectum of 4 dpf Tg[mpeg1:mCherryF] (A1) and Tg[mpeg1:mCherryF]; scn1Lab-KD (B2) larvae showing microglial cells, and 3D reconstructions of microglia in Tg[mpeg1:mCherryF] (A2,A3) and Tg[mpeg1:mCherryF]; scn1Lab-KD (B2,B3) individuals. (C–G) Quantification of microglia sphericity (C), number of processes (D), total process length (E), mean process length (F), and ramification index (G), in 4 dpf Tg[mpeg1:mCherryF]; scn1Lab-KD (N = 11; n = 239) and Tg[mpeg1:mCherryF] larvae (N = 11; n = 228). (H) Sholl analysis of Tg[mpeg1:mCherryF] (black) and Tg[mpeg1:mCherryF]; scn1Lab-KD (blue) microglia branching. (I) Scheme of the head of a zebrafish larva with the area of interest (the periventricular stratum) framed in red. (J) Cluster analysis of microglia populations in 4 dpf Tg[mpeg1:mCherryF]; scn1Lab-KD larvae (N = 11; n = 239) and Tg[mpeg1:mCherryF] sibling controls (N = 11; n = 228), according to sphericity (S), number of processes (NP), total process length (TL), area (A), and volume (V), leading to three cell populations. (K) Repartition of control (white) and scn1Lab-KD (blue) microglia populations in the three clusters defined (“branched”, “amoeboid”, and “intermediate”). All data are represented as the mean ± sem. p-values were determined using Mann–Whitney or unpaired Student t-test depending on the normal distribution of the values. n.s., non-significant; *, p < 0.05; **, p < 0.01; ***, p < 0.001; ****, p < 0.0001. Scale bars: 50 µm (A1,B1); 10 µm (A2,A3,B2,B3).
|
