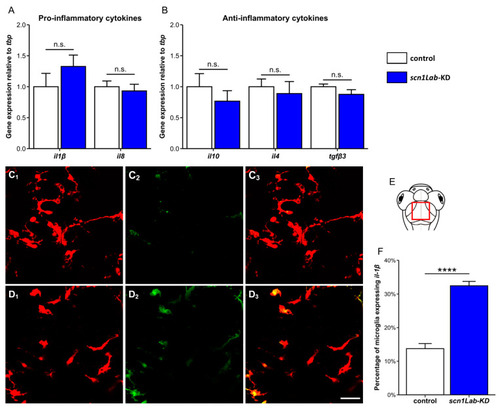
Cytokine expression in scn1Lab-KD larvae. (A,B) Quantification of the expression of genes encoding pro- (Il1β and Il8) (A), and anti-inflammatory cytokines (Il10, Il4, and Tgfβ3) (B), relative to that of the tbp gene, in the brains of 4 dpf not-injected (white) and scn1Lab-KD (blue) larvae. (C,D) Dorsal view of the periventricular stratum of 4 dpf Tg[mpeg1:mCherryF] (C1–C3) and Tg[mpeg1:mCherryF]; scn1Lab-KD larvae (D1–D3), showing Il1β-expressing microglial cells (C2,D2). Note that while part of “amoeboid” microglial cells only expressed the il1β:GFP transgene, few highly branched microglia also expressed il1β:GFP. (E) Scheme of a zebrafish larval head with the area of interest (the periventricular stratum) framed in red. (F) Quantification of the percentage of microglial cells expressing Il1β:GFP in not-injected (N = 19) and scn1Lab-KD larvae (N = 16). Scale: 10 µm. N = number of larvae analyzed. All images were acquired using a Leica SP8 confocal microscope, equipped with a 20×/water objective with a numerical aperture of 0.75. All graphs represent mean ± sem. The p-values were calculated using a Student’s t-test. n.s., not significant; ****, p < 0.0001.
|
