FIGURE SUMMARY
Title

Kalium channelrhodopsins effectively inhibit neurons

Authors
Ott, S., Xu, S., Lee, N., Hong, I., Anns, J., Suresh, D.D., Zhang, Z., Zhang, X., Harion, R., Ye, W., Chandramouli, V., Jesuthasan, S., Saheki, Y., Claridge-Chang, A.
Source
Full text @ Nat. Commun.

Membrane-trafficking signals improve KCR localization to axons.

A Schematic of ACR and KCR channelrhodopsins. ACRs are chloride-selective and inhibit spiking via chloride influx. KCRs are potassium-selective and inhibit neuronal activity via the endogenous repolarization process. B A schematic of three KCR fusion arrangements; the ET variants contain membrane targeting sequences. CG Representative confocal images of fly brains expressing KCR1-AAA (C), KCR1-GS (D), KCR1-ET (E), KCR2-ET (F), and ACR1 (G) in the mushroom bodies (MB) with MB247-Gal4. ACR1 and the KCR-ET variants show robust signals in the axonal MB lobe region, whereas KCR1-GS and KCR1-AAA show strong somatic signals. Anti-disks large (DLG) or anti-Bruchpilot (Brp) stains are shown in magenta and anti-GFP staining is shown in green. Scale bar = 50 μm. For each genotype, n = 1 biologically independent sample over 1 independent experiment. H Quantifications of anti-GFP intensity in posterior (P) and anterior (A) brain regions for each opsin transgene crossed with MB247-Gal4. Top: Individual brain hemispheres are shown as slope plots. The height of the bars shows average intensity values. Bottom: Posterior–anterior mean differences of anti-GFP intensities; error bars represent the 95% CI. For each genotype, n = 12 biologically independent samples over 12 independent experiments. I Representative images of opsin expression in transfected N2a cell culture. KCR1-GS displayed stronger cell-interior localization whereas KCR1-ET, KCR2-ET, and ACR1 showed increased plasma-membrane localization. Scale bar = 10 µm. For each genotype, n = 1 biologically independent sample over 1 independent experiment. Additional statistical information is presented in Supplementary Dataset 1. Source data are provided as a Source Data file.

KCR actuation inhibits climbing and walking in Drosophila.

A Schematic of the single-fly climbing assay, showing the chamber on the left and the different assay elements on the right. BE Averaged climbing performance of flies expressing the respective opsin with OK371-Gal4 and the corresponding Gal4 driver and UAS responder controls (gray) in the presence of light. In the schematic bar (top), black indicates the 3s baseline, and the colored bar indicates the illumination interval. The y-axis on the right indicates the mean difference in effect size between the genotypic controls and test flies. The last 10s of the experiment were used for effect size comparisons. Error bands represent the 95% CI. OK371 > ACR1 test, n = 136 biologically independent animals over 8 independent experiments, OK371 > ACR1 controls, n = 255 biologically independent animals over 15 independent experiments. OK371 > KCR1-ET test, n = 119 biologically independent animals over 8 independent experiments, OK371 > KCR1-ET controls, n = 238 biologically independent animals over 14 independent experiments. OK371 > KCR1-GS test, n = 136 biologically independent animals over 8 independent experiments, OK371 > KCR1-GS controls, n = 221 biologically independent animals over 13 independent experiments. OK371 > KCR2-ET test, n = 116 biologically independent animals over 7 independent experiments, OK371 > ACR1 controls, n = 136 biologically independent animals over 8 independent experiments. FH Averaged climbing performance of flies expressing the respective opsin with elav-Gal4 and the corresponding genotypic controls in the presence of light. Green illumination intensity was 11 μW/mm2. The blue illumination intensity of KCR2-ET was 85 μW/mm2. Error bands represent the 95% CI. elav > ACR1 test, n = 153 biologically independent animals over 9 independent experiments, elav > ACR1 controls, n = 255 biologically independent animals over 15 independent experiments. elav > KCR1-ET test, n = 135 biologically independent animals over 8 independent experiments, elav > KCR1-ET controls, n = 255 biologically independent animals over 15 independent experiments. elav > KCR1-GS test, n = 117 biologically independent animals over 7 independent experiments, elav > KCR1-GS controls, n = 255 biologically independent animals over 15 independent experiments. I Schematic representation of the walking assay with the chamber view from the front (left) and the experimental setup view from the top (right). J Walking-speed comparisons before and during illumination (24 µW/mm2). The left side of the plot displays the activity of individual flies (dots), and the gap between the horizontal error bars represents the mean. The right side of the plot displays the speed mean difference effect size for each respective genotype. Error bars represent the 95% CI. OK371/+,n = 75 biologically independent animals over 3 independent experiments. ACR1/+,n = 61 biologically independent animals over 3 independent experiments. KCR1-ET/+,n = 63 biologically independent animals over 3 independent experiments. KCR1-GS/+,n = 73 biologically independent animals over 3 independent experiments. OK371 > ACR1,n = 69 biologically independent animals over 3 independent experiments. OK371 > KCR1-ET,n = 57 biologically independent animals over 3 independent experiments. OK371 > KCR1-GS,n = 48 biologically independent animals over 2 independent experiments. Additional statistical information for all panels is presented in Supplementary Dataset 1. Source data are provided as a Source Data file.

KCR1 and ACR1 actuation show comparable effects on feeding and memory.

A Expression profiles of Gr64f > ACR1 and Gr64f > KCR1-ET flies. Anti-Brp staining is shown in magenta and anti-GFP staining is shown in green. For each genotype, n = 1 biologically independent sample over 1 independent experiment. Scale bar = 50 μm. B Schematic of the ESPRESSO feeding assay chip. C Feeding events in the presence and absence of green light illumination (24 μW/mm2). The schematic bar at the top indicates the illumination epochs in green. The number and size of the bubbles indicate the count and volume of individual feeds, respectively. D The top plot displays the averaged paired comparisons of feeding volume between the lights off and on testing epochs. The bottom plot shows the averaged mean difference in feeding volume effect size for the light off and on epochs. Error bars show the 95% CI. Gr64f/+, n = 36 biologically independent animals over 3 independent experiments. ACR1/+, n = 18 biologically independent animals over 3 independent experiments. Gr64f > ACR1, n = 30 biologically independent animals over 3 independent experiments. KCR1-ET/+, n = 28 biologically independent animals over 3 independent experiments. Gr64f > KCR1-ET,n = 41 biologically independent animals over 3 independent experiments. E Schematic of the olfactory training assay. F, G Green light actuation of the MB cells (58 μW/mm2) with MB247 > ACR1 (F) and MB247 > KCR1-ET (G) strongly impaired shock-odor memory. Retesting the same animals in the absence of illumination restored conditioned shock-odor avoidance. The panels show the dynamic shock-odor avoidance performance index (PI) during the light-on and light-off testing epochs. Flies were agitated by five air puffs between the two testing epochs. The schematic (top) indicates the periods of illumination (green rectangle) and agitation (blue rectangle). The axis on the right shows the mean difference effect size comparison between the PI of the controls and the test genotype. The dashed rectangle indicates the time interval used for effect size comparisons. Error bands represent the 95% CI. MB247 > ACR1 test, n = 228 biologically independent animals over 4 independent experiments, MB247 > ACR1 controls, n = 348 biologically independent animals over 6 independent experiments. MB247 > KCR1-ET test, n = 216 biologically independent animals over 5 independent experiments, MB247 > KCR1-ET controls, n = 396 biologically independent animals over 8 independent experiments. Additional statistical information is presented in Supplementary Dataset 1. Source data are provided as a Source Data file.

Spontaneous spiking in a larval abdominal nerve is silenced by KCR1.

A Representative traces from extracellular recordings of Drosophila larvae abdominal nerve 3. ACR1, KCR1-GS, and KCR1-ET channelrhodopsins were expressed pan-neuronally with elav-Gal4. Actuation with green light (40 μW/mm2) was induced for 30 s (schematic on top). For each genotype n = 1 biologically independent sample over 1 independent experiment. B Rasters of action-potential occurrences in larvae expressing elav > ACR1, elav > KCR1-GS, and elav > KCR1-ET. For each genotype, n = 3 biologically independent samples over 3 independent experiments. C Averaged spike-frequency charts for the test genotypes. D A reduction in action potentials was detected in ACR1/+ and KCR1-GS/+ controls, but not in KCR1-ET/+ or in elav/+ controls. For each genotype in C, D, n = 3 biologically independent samples over 3 independent experiments. Error bars show 95% CI. E Quantification of spike totals in the 30 s epochs before and during actuation. Each dot in the scatter plot (top) represents the number of spikes per recording. The differences in spike counts before versus during actuation are shown (bottom). F Quantification of spike totals using 0.5 s light actuation. Error bars in E and F show 95% CI. For each genotype, n = 3 biologically independent samples over 3 independent experiments. Additional information on effect-size statistics is presented in Supplementary Dataset 1. Source data are provided as a Source Data file.

KCR actuation impairs locomotion in C. elegans.

A Representative live confocal images of C. elegans head regions expressing the respective opsin in neurons; YFP signals are shown in green. Nerve ring regions that contain bundles of neuronal processes are flanked by yellow arrowheads. Scale bar = 20 µm. For each genotype, n = 1 biologically independent sample over 1 independent experiment. B Schematic representation of the worm tracking chambers and setup. C. elegans movement was captured via video acquisition and evaluated by post hoc processing with DeepLabCut (see “Methods”). CE Comparisons of average changes in speed during light actuation (green = 75 μW/mm2, blue = 65 μW/mm2) between wild-type controls and opsin-expressing worms at different ATR concentrations. Each dot in the scatter plots (top) represents one worm and the height of the bar shows the average speed. The Δspeed comparisons between wild-type controls and the respective genotype are shown (bottom). The same wild-type controls were shared between the ACR1 and KCR1-ET experiments. Error bars show 95% CI. Wild-type controls for ACR and KCR1-ET n = 16 biologically independent animals over 16 independent experiments. snt1-P > ACR1 0 mM ATR, n = 3 biologically independent animals over 3 independent experiments. snt1-P > ACR1 0.25 mM ATR, n = 7 biologically independent animals over 7 independent experiments. snt1-P > ACR1 0.5 mM ATR, n = 6 biologically independent animals over 6 independent experiments. snt1-P > ACR1 1 mM ATR, n = 4 biologically independent animals over 4 independent experiments. snt1-P > ACR1 2 mM ATR, n = 5 biologically independent animals over 5 independent experiments. snt1-P > KCR1-ET 0 mM ATR, n = 3 biologically independent animals over 3 independent experiments. snt1-P > KCR1-ET 0.25 mM ATR, n = 11 biologically independent animals over 11 independent experiments. snt1-P > KCR1-ET 0.5 mM ATR, n = 3 biologically independent animals over 3 independent experiments. snt1-P > KCR1-ET 1 mM ATR, n = 11 biologically independent animals over 11 independent experiments. snt1-P > KCR1-ET 2 mM ATR, n = 7 biologically independent animals over 7 independent experiments. Wild-type controls for KCR2-ET, n = 13 biologically independent animals over 13 independent experiments. snt1-P > KCR2-ET 0 mM ATR, n = 4 biologically independent animals over 4 independent experiments. snt1-P > KCR2-ET 0.25 mM ATR, n = 3 biologically independent animals over 3 independent experiments. snt1-P > KCR2-ET 0.5 mM ATR, n = 4 biologically independent animals over 4 independent experiments. snt1-P > KCR2-ET 1 mM ATR, n = 3 biologically independent animals over 3 independent experiments. snt1-P > KCR2-ET 2 mM ATR, n = 3 biologically independent animals over 3 independent experiments. FK The panels show the average speed of C. elegans 10 s before, during, and after actuation. The average crawling speed of worms grown with 0.5 mM ATR (FH) or 1 mM ATR (IK) are shown in the top and bottom panels, respectively. Error bands represent the 95% CI. For ACR 0.5 mM ATR control, n = 9 biologically independent animals over 9 independent experiments. For snt1-P > ACR1 0.5 mM ATR, n = 6 biologically independent animals over 6 independent experiments. For KCR1-ET 0.5 mM ATR control, n = 5 biologically independent animals over 5 independent experiments. For snt1-P > KCR1-ET 0.5 mM ATR, n = 4 biologically independent animals over 4 independent experiments. For KCR2-ET 0.5 mM ATR control, n = 8 biologically independent animals over 8 independent experiments. For snt1-P > KCR2-ET 0.5 mM ATR, n = 3 biologically independent animals over 3 independent experiments. For ACR 1 mM ATR control, n = 11 biologically independent animals over 11 independent experiments. For snt1-P > ACR1 1 mM, n = 5 biologically independent animals over 5 independent experiments. For KCR1-ET 1 mM ATR control, n = 8 biologically independent animals over 8 independent experiments. For snt1-P > KCR1-ET 1 mM ATR, n = 4 biologically independent animals over 4 independent experiments. For KCR2-ET 1 mM ATR control, n = 9 biologically independent animals over 9 independent experiments. For snt1-P > KCR2-ET 1 mM ATR, n = 3 biologically independent animals over 3 independent experiments. Additional statistical information for all panels is presented in Supplementary Dataset 1. Source data are provided as a Source Data file.

KCR1 actuation inhibits zebrafish larval movements.

A Zebrafish embryos showing expression of the jRGECO1a red fluorescent protein and KCR1-ET with a YFP tag. The proteins were expressed in all spinal motor neurons under the control of the GAL4s1020t driver. Scale bar = 100 µm, n = 1 biologically independent sample over 1 independent experiment. B KCR1-ET is expressed in cell bodies and neurites, with very sparse expression in muscle cells. Scale bar = 100 µm, n = 1 biologically independent sample over 1 independent experiment. C, D Relative movement of KCR1-ET embryos and non-expressing sibling controls before, during, and after illumination with green light, as indicated by the green panels. Movement in embryos expressing KCR1-ET is suppressed by green light E, F KCR1-GS embryos and control siblings: the former show a pronounced suppression of movement. G, H Embryos expressing ACR2 and non-expressing sibling controls. Movement in the ACR2 embryos is suppressed by green light. Line plots show mean relative movement per second with 95% CI error bands. For all genotypes shown in panels (CH), n = 50 biologically independent animals over 50 independent experiments. Additional statistical information for all panels is presented in Supplementary Dataset 1. Source data are provided as a Source Data file.

KCR1-ET affects cells with non-canonical chloride signaling.

A Schematic of the heating assay: heating larvae results in a corkscrew nocifensive motor response; inhibiting nociceptors could delay response onset. B Onset of the initial nocifensive response of larvae during heating. Actuating c240 > KCR1-ET larvae with green light (51 μW/mm2) raised the nocifensive threshold temperature. The plot shows the observed values (top), mean differences, and ∆∆values (bottom). Error bars represent the 95% CI. Genotypic controls, n = 63 biologically independent animals over 1 independent experiment. c240 > ACR1, n = 45 biologically independent animals over 1 independent experiment. Genotypic controls n = 60 biologically independent animals over 1 independent experiment. c240 > KCR1-ET, n = 47 biologically independent animals over 1 independent experiment. C Representative images of third-instar larvae after ingestion of dyed food. Hodor/+ = 22 biologically independent animals over 2 independent experiments. KCR1-ET/+ = 17 biologically independent animals over 2 independent experiments. KCR1-GS/+ = 9 biologically independent animals over 2 independent experiments. ACR1/+ = 16 biologically independent animals over 2 independent experiments. Hodor > ACR1 = 21 biologically independent animals over 2 independent experiments. Hodor > KCR1-GS = 12 biologically independent animals over 2 independent experiments. Hodor > KCR1-ET = 23 biologically independent animals over 2 independent experiments. D Dye intensity comparisons between controls, hodor > ACR1, and hodor > KCR1-ET larvae. The top axes show the dye staining intensity. Each dot represents one larva and the bar indicates the mean intensity. The bottom axes show the mean difference effect sizes and relative overall decrease (∆∆) between the two opsins. Error bars show the 95% CI. Genotypic controls for ACR, n = 27 biologically independent animals over 2 independent experiments. Hodor > ACR1 = 21 biologically independent animals over 2 independent experiments. Genotypic controls for KCR1-ET, n = 23 biologically independent animals over 2 independent experiments. Hodor > KCR1-ET = 28 biologically independent animals over 2 independent experiments. Additional statistical information for all panels is presented in Supplementary Dataset 1. Source data are provided as a Source Data file.

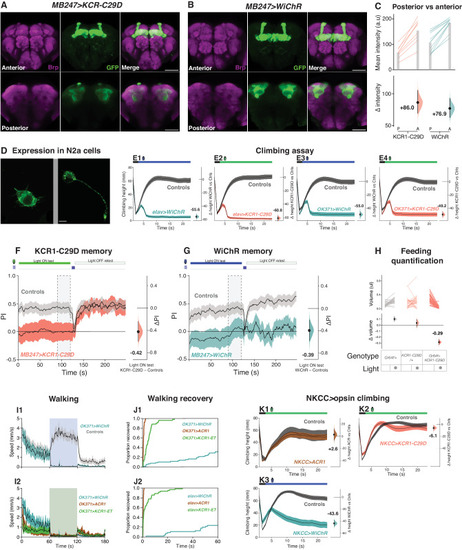
KCRs with improved K+ selectivity have increased potency.

A, B Representative confocal images of fly brains carrying AMB247 > KCR1-C29D or BMB247 > WiChR. Both opsins are strongly expressed in the MB lobe axonal regions. Anti-Brp staining is shown in magenta and anti-GFP staining is shown in green. Scale bar = 50 μm. For both genotypes, n = 1 biologically independent sample over 1 independent experiment. C Quantifications of anti-GFP intensity in posterior (P) and anterior (A) brain regions for KCR1-C29D and WiChR crossed with MB247-Gal4. Top: individual brain hemispheres are shown as slope plots. The height of the gray bars shows average intensity values. Bottom: posterior–anterior mean difference effect sizes of anti-GFP intensities; error bars represent the 95% CI. MB247 > KCR1-C9D, n = 4 biologically independent samples over 4 independent experiments. MB247 > WiChR, n = 6 biologically independent samples over 6 independent experiments. D Representative images of the opsins in N2a cells. (Left) KCR1-C29D and (Right) WiChR showed expression at the membrane, along with some intracellular puncta. Scale bar = 10 µm. For both genotypes, n = 1 biologically independent sample over 1 independent experiment. E Climbing performance of WiChR (E1 and E3) and KCR1-C29D (E2 and E4) flies in the presence of light. The opsins were expressed pan-neuronally (elav-Gal4, E1-2) or in motor neurons (OK371-Gal4, E3-4). The performance of opsin-expressing flies was compared with the averaged performance of the corresponding Gal-4 driver and UAS responder controls (gray) in the presence of light. The last 10 s of the experiment were used for effect-size comparisons. Error bars represent the 95% CI. Green illumination intensity was 11 μW/mm2. Blue illumination was 85 μW/mm2. Genotypic controls for elav > WiChR, n = 209 biologically independent animals over 14 independent experiments. Elav > WiChR, n = 193 biologically independent animals over 13 independent experiments. Genotypic controls for elav > KCR1-C29D, n = 250 biologically independent animals over 16 independent experiments. Elav > KCR1-C29D, n = 156 biologically independent animals over 11 independent experiments. Genotypic controls for OK371 > WiChR, n = 211 biologically independent animals over 14 independent experiments. OK371 > WiChR, n = 176 biologically independent animals over 11 independent experiments. Genotypic controls for OK371 > KCR1-C29D, n = 278 biologically independent animals over 18 independent experiments. OK371 > KCR1-C29D, n = 176 biologically independent animals over 10 independent experiments. F, G Inhibiting MB neurons with MB247 > KCR1-C29D (F) or MB247 > WiChR (G) impaired shock-odor memory. Retesting the same animals in the absence of illumination restored conditioned odor avoidance (PI) in KCR1-C29D flies. The performance of WiChR-expressing flies remained low during retest. Green light illumination intensity was 58 µW/mm2. Blue light illumination was 21 μW/mm2. Error bands show 95% CI. Genotypic controls for MB247 > KCR1-C29D, n = 600 biologically independent animals over 12 independent experiments. MB247 > KCR1-C29D, n = 354 biologically independent animals over 7 independent experiments. Genotypic controls for MB247 > WiChR, n = 528 biologically independent animals over 11 independent experiments. MB247 > WiChR, n = 312 biologically independent animals over 6 independent experiments. H The top panel displays the averaged paired comparisons of feeding volume between the lights off and on testing epochs for Gr64f > KCR1-C29D flies and genotypic controls. The bottom panel shows the averaged mean difference in feeding volume effect size for the light off and on epochs. Green light illumination intensity was 24 µW/mm2. Error bars show 95% CI. KCR1-C29D/+, n = 27 biologically independent animals over 3 independent experiments. Gr64f/+, n = 29 biologically independent animals over 3 independent experiments. Gr664f > KCR1-C29D, n = 33 biologically independent animals over 3 independent experiments. I The top panel (I1) shows the averaged horizontal walking speed of OK371 > WiChR flies and genotypic controls before, during (indicated by blue and green boxes), and after light actuation. The bottom panel (I2) shows the speed of the same OK371 > WiChR flies and speeds for flies expressing OK371 > ACR1 and OK371 > KCR1-ET. Error bands show a 95% CI. Green light illumination intensity was 24 µW/mm2. Blue light illumination was 24 μW/mm2. Genotypic controls for WiChR, n = 126 biologically independent animals over 7 independent experiments. OK371 > WiChR, n = 80 biologically independent animals over 5 independent experiments. OK371 > ACR1, n = 72 biologically independent animals over 8 independent experiments. OK371 > KCR1-ET, n = 58 biologically independent animals over 6 independent experiments. J Kaplan–Meier post-actuation recovery plots for flies expressing opsins in motor neurons (OK371-Gal4, J1) or pan-neuronally (elav-Gal4, J2). All flies expressing ACR1 recovered in the first 2 s. The majority of KCR1-ET flies recovered in the first 10 s and the majority of WiChR-expressing flies remained immobile >60 s after illumination. OK371 > WiChR, n = 80 biologically independent animals over 1 independent experiment. OK371 > ACR1, n = 72 biologically independent animals over 1 independent experiment. OK371 > KCR1-ET, n = 58 biologically independent animals over 1 independent experiment. Elav > WiChR, n = 55 biologically independent animals over 1 independent experiment. Elav > ACR1, n = 64 biologically independent animals over 1 independent experiment. Elav > KCR1-ET, n = 66 biologically independent animals over 1 independent experiment. K Climbing performance of NKCC > ACR1 (K1), NKCC > KCR1-C29D (K2), and NKCC > WiChR (K3) flies and their respective genotypic controls (gray) during light illumination. Exposing NKCC > ACR1 flies to light did not impair climbing performance. Light exposure induced twitching behavior and occasional falls in NKCC > KCR1-C29D flies. Overall, the light effect was not sufficiently strong to induce substantial climbing impairment. During illumination, NKCC > WiChR flies displayed twitching, falls, and partial paralysis which led to a strong reduction in climbing. The last 10 s of the experiment were used for effect size comparisons. Error bands represent the 95% CI. Green light illumination intensity was 11 μW/mm2. Blue light illumination was 85 μW/mm2. Genotypic controls for ACR, n = 201 biologically independent animals over 12 independent experiments. NKCC > ACR1, n = 41 biologically independent animals over 6 independent experiments. Genotypic controls for KCR1-C29D, n = 204 biologically independent animals over 12 independent experiments. NKCC > KCR1-C29D, n = 102 biologically independent animals over 6 independent experiments. Genotypic controls for WiChR, n = 204 biologically independent animals over 12 independent experiments. NKCC > WiChR,n = 97 biologically independent animals over 6 independent experiments. Additional statistical information for all panels is presented in Supplementary Dataset 1. Source data are provided as a Source Data file.

Acknowledgments
This image is the copyrighted work of the attributed author or publisher, and ZFIN has permission only to display this image to its users. Additional permissions should be obtained from the applicable author or publisher of the image. Full text @ Nat. Commun.