|
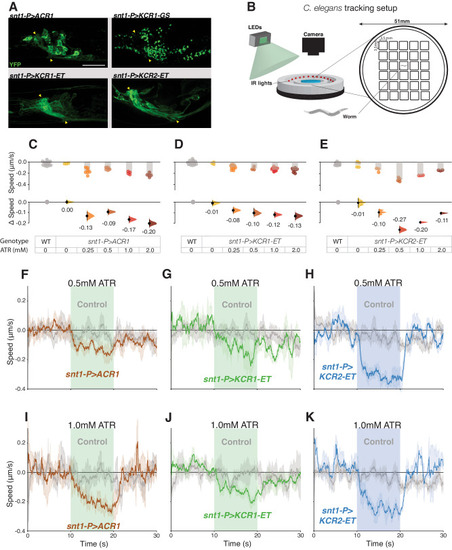
KCR actuation impairs locomotion in C. elegans. A Representative live confocal images of C. elegans head regions expressing the respective opsin in neurons; YFP signals are shown in green. Nerve ring regions that contain bundles of neuronal processes are flanked by yellow arrowheads. Scale bar = 20 µm. For each genotype, n = 1 biologically independent sample over 1 independent experiment. B Schematic representation of the worm tracking chambers and setup. C. elegans movement was captured via video acquisition and evaluated by post hoc processing with DeepLabCut (see “Methods”). C–E Comparisons of average changes in speed during light actuation (green = 75 μW/mm2, blue = 65 μW/mm2) between wild-type controls and opsin-expressing worms at different ATR concentrations. Each dot in the scatter plots (top) represents one worm and the height of the bar shows the average speed. The Δspeed comparisons between wild-type controls and the respective genotype are shown (bottom). The same wild-type controls were shared between the ACR1 and KCR1-ET experiments. Error bars show 95% CI. Wild-type controls for ACR and KCR1-ET n = 16 biologically independent animals over 16 independent experiments. snt1-P > ACR1 0 mM ATR, n = 3 biologically independent animals over 3 independent experiments. snt1-P > ACR1 0.25 mM ATR, n = 7 biologically independent animals over 7 independent experiments. snt1-P > ACR1 0.5 mM ATR, n = 6 biologically independent animals over 6 independent experiments. snt1-P > ACR1 1 mM ATR, n = 4 biologically independent animals over 4 independent experiments. snt1-P > ACR1 2 mM ATR, n = 5 biologically independent animals over 5 independent experiments. snt1-P > KCR1-ET 0 mM ATR, n = 3 biologically independent animals over 3 independent experiments. snt1-P > KCR1-ET 0.25 mM ATR, n = 11 biologically independent animals over 11 independent experiments. snt1-P > KCR1-ET 0.5 mM ATR, n = 3 biologically independent animals over 3 independent experiments. snt1-P > KCR1-ET 1 mM ATR, n = 11 biologically independent animals over 11 independent experiments. snt1-P > KCR1-ET 2 mM ATR, n = 7 biologically independent animals over 7 independent experiments. Wild-type controls for KCR2-ET, n = 13 biologically independent animals over 13 independent experiments. snt1-P > KCR2-ET 0 mM ATR, n = 4 biologically independent animals over 4 independent experiments. snt1-P > KCR2-ET 0.25 mM ATR, n = 3 biologically independent animals over 3 independent experiments. snt1-P > KCR2-ET 0.5 mM ATR, n = 4 biologically independent animals over 4 independent experiments. snt1-P > KCR2-ET 1 mM ATR, n = 3 biologically independent animals over 3 independent experiments. snt1-P > KCR2-ET 2 mM ATR, n = 3 biologically independent animals over 3 independent experiments. F–K The panels show the average speed of C. elegans 10 s before, during, and after actuation. The average crawling speed of worms grown with 0.5 mM ATR (F–H) or 1 mM ATR (I–K) are shown in the top and bottom panels, respectively. Error bands represent the 95% CI. For ACR 0.5 mM ATR control, n = 9 biologically independent animals over 9 independent experiments. For snt1-P > ACR1 0.5 mM ATR, n = 6 biologically independent animals over 6 independent experiments. For KCR1-ET 0.5 mM ATR control, n = 5 biologically independent animals over 5 independent experiments. For snt1-P > KCR1-ET 0.5 mM ATR, n = 4 biologically independent animals over 4 independent experiments. For KCR2-ET 0.5 mM ATR control, n = 8 biologically independent animals over 8 independent experiments. For snt1-P > KCR2-ET 0.5 mM ATR, n = 3 biologically independent animals over 3 independent experiments. For ACR 1 mM ATR control, n = 11 biologically independent animals over 11 independent experiments. For snt1-P > ACR1 1 mM, n = 5 biologically independent animals over 5 independent experiments. For KCR1-ET 1 mM ATR control, n = 8 biologically independent animals over 8 independent experiments. For snt1-P > KCR1-ET 1 mM ATR, n = 4 biologically independent animals over 4 independent experiments. For KCR2-ET 1 mM ATR control, n = 9 biologically independent animals over 9 independent experiments. For snt1-P > KCR2-ET 1 mM ATR, n = 3 biologically independent animals over 3 independent experiments. Additional statistical information for all panels is presented in Supplementary Dataset 1. Source data are provided as a Source Data file.
|