|
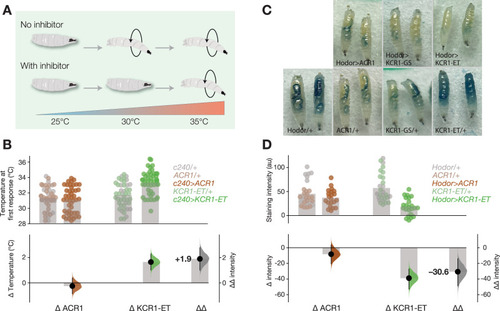
KCR1-ET affects cells with non-canonical chloride signaling. A Schematic of the heating assay: heating larvae results in a corkscrew nocifensive motor response; inhibiting nociceptors could delay response onset. B Onset of the initial nocifensive response of larvae during heating. Actuating c240 > KCR1-ET larvae with green light (51 μW/mm2) raised the nocifensive threshold temperature. The plot shows the observed values (top), mean differences, and ∆∆values (bottom). Error bars represent the 95% CI. Genotypic controls, n = 63 biologically independent animals over 1 independent experiment. c240 > ACR1, n = 45 biologically independent animals over 1 independent experiment. Genotypic controls n = 60 biologically independent animals over 1 independent experiment. c240 > KCR1-ET, n = 47 biologically independent animals over 1 independent experiment. C Representative images of third-instar larvae after ingestion of dyed food. Hodor/+ = 22 biologically independent animals over 2 independent experiments. KCR1-ET/+ = 17 biologically independent animals over 2 independent experiments. KCR1-GS/+ = 9 biologically independent animals over 2 independent experiments. ACR1/+ = 16 biologically independent animals over 2 independent experiments. Hodor > ACR1 = 21 biologically independent animals over 2 independent experiments. Hodor > KCR1-GS = 12 biologically independent animals over 2 independent experiments. Hodor > KCR1-ET = 23 biologically independent animals over 2 independent experiments. D Dye intensity comparisons between controls, hodor > ACR1, and hodor > KCR1-ET larvae. The top axes show the dye staining intensity. Each dot represents one larva and the bar indicates the mean intensity. The bottom axes show the mean difference effect sizes and relative overall decrease (∆∆) between the two opsins. Error bars show the 95% CI. Genotypic controls for ACR, n = 27 biologically independent animals over 2 independent experiments. Hodor > ACR1 = 21 biologically independent animals over 2 independent experiments. Genotypic controls for KCR1-ET, n = 23 biologically independent animals over 2 independent experiments. Hodor > KCR1-ET = 28 biologically independent animals over 2 independent experiments. Additional statistical information for all panels is presented in Supplementary Dataset 1. Source data are provided as a Source Data file.
|