|
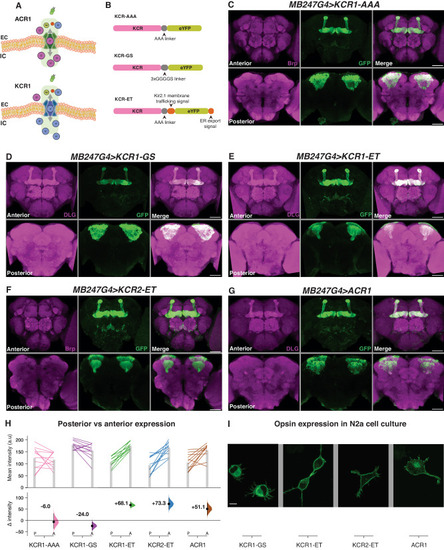
Membrane-trafficking signals improve KCR localization to axons. A Schematic of ACR and KCR channelrhodopsins. ACRs are chloride-selective and inhibit spiking via chloride influx. KCRs are potassium-selective and inhibit neuronal activity via the endogenous repolarization process. B A schematic of three KCR fusion arrangements; the ET variants contain membrane targeting sequences. C–G Representative confocal images of fly brains expressing KCR1-AAA (C), KCR1-GS (D), KCR1-ET (E), KCR2-ET (F), and ACR1 (G) in the mushroom bodies (MB) with MB247-Gal4. ACR1 and the KCR-ET variants show robust signals in the axonal MB lobe region, whereas KCR1-GS and KCR1-AAA show strong somatic signals. Anti-disks large (DLG) or anti-Bruchpilot (Brp) stains are shown in magenta and anti-GFP staining is shown in green. Scale bar = 50 μm. For each genotype, n = 1 biologically independent sample over 1 independent experiment. H Quantifications of anti-GFP intensity in posterior (P) and anterior (A) brain regions for each opsin transgene crossed with MB247-Gal4. Top: Individual brain hemispheres are shown as slope plots. The height of the bars shows average intensity values. Bottom: Posterior–anterior mean differences of anti-GFP intensities; error bars represent the 95% CI. For each genotype, n = 12 biologically independent samples over 12 independent experiments. I Representative images of opsin expression in transfected N2a cell culture. KCR1-GS displayed stronger cell-interior localization whereas KCR1-ET, KCR2-ET, and ACR1 showed increased plasma-membrane localization. Scale bar = 10 µm. For each genotype, n = 1 biologically independent sample over 1 independent experiment. Additional statistical information is presented in Supplementary Dataset 1. Source data are provided as a Source Data file.
|