IMAGE

Fig. 3

ID
ZDB-IMAGE-240426-93
Source
Figures for Ott et al., 2024
Image
Figure Caption

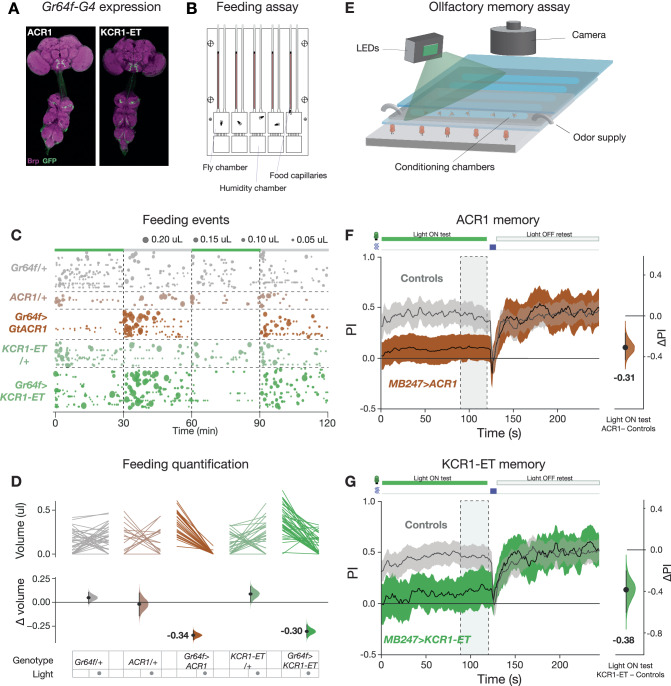
Fig. 3 KCR1 and ACR1 actuation show comparable effects on feeding and memory.

A Expression profiles of Gr64f > ACR1 and Gr64f > KCR1-ET flies. Anti-Brp staining is shown in magenta and anti-GFP staining is shown in green. For each genotype, n = 1 biologically independent sample over 1 independent experiment. Scale bar = 50 μm. B Schematic of the ESPRESSO feeding assay chip. C Feeding events in the presence and absence of green light illumination (24 μW/mm2). The schematic bar at the top indicates the illumination epochs in green. The number and size of the bubbles indicate the count and volume of individual feeds, respectively. D The top plot displays the averaged paired comparisons of feeding volume between the lights off and on testing epochs. The bottom plot shows the averaged mean difference in feeding volume effect size for the light off and on epochs. Error bars show the 95% CI. Gr64f/+, n = 36 biologically independent animals over 3 independent experiments. ACR1/+, n = 18 biologically independent animals over 3 independent experiments. Gr64f > ACR1, n = 30 biologically independent animals over 3 independent experiments. KCR1-ET/+, n = 28 biologically independent animals over 3 independent experiments. Gr64f > KCR1-ET,n = 41 biologically independent animals over 3 independent experiments. E Schematic of the olfactory training assay. F, G Green light actuation of the MB cells (58 μW/mm2) with MB247 > ACR1 (F) and MB247 > KCR1-ET (G) strongly impaired shock-odor memory. Retesting the same animals in the absence of illumination restored conditioned shock-odor avoidance. The panels show the dynamic shock-odor avoidance performance index (PI) during the light-on and light-off testing epochs. Flies were agitated by five air puffs between the two testing epochs. The schematic (top) indicates the periods of illumination (green rectangle) and agitation (blue rectangle). The axis on the right shows the mean difference effect size comparison between the PI of the controls and the test genotype. The dashed rectangle indicates the time interval used for effect size comparisons. Error bands represent the 95% CI. MB247 > ACR1 test, n = 228 biologically independent animals over 4 independent experiments, MB247 > ACR1 controls, n = 348 biologically independent animals over 6 independent experiments. MB247 > KCR1-ET test, n = 216 biologically independent animals over 5 independent experiments, MB247 > KCR1-ET controls, n = 396 biologically independent animals over 8 independent experiments. Additional statistical information is presented in Supplementary Dataset 1. Source data are provided as a Source Data file.

Acknowledgments
This image is the copyrighted work of the attributed author or publisher, and ZFIN has permission only to display this image to its users. Additional permissions should be obtained from the applicable author or publisher of the image. Full text @ Nat. Commun.