
- Title
-
ptx3a+ fibroblast/epicardial cells provide a transient macrophage niche to promote heart regeneration
- Authors
- Sun, J., Peterson, E.A., Chen, X., Wang, J.
- Source
- Full text @ Cell Rep.
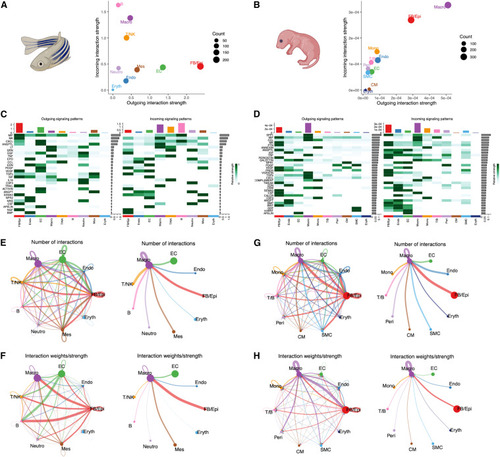
Tight communication between Fb/Epi cells and macrophages during zebrafish and neonatal mice heart regeneration (A) Scatterplot showing the overall incoming and outgoing communication strength based on receptor and ligand expression in the regenerating zebrafish heart. Circle size represents the total number of interactions associated with each cell cluster. (B) Scatterplot showing the overall incoming and outgoing communication strength based on receptor and ligand expression in the regenerating neonatal mouse heart. Circle size represents the total number of interactions associated with each cell cluster. (C) Heatmap showing the summary of the signaling pathways that contribute to outgoing or incoming communication in the regenerating zebrafish heart. The color bar represents the relative signaling strength of a signaling pathway across cell types. The bars indicate the sum of the signaling strength of each cell type. (D) Heatmap showing the summary of the signaling pathways that contribute to outgoing or incoming communication in the regenerating neonatal mouse heart. The color bar represents the relative signaling strength of a signaling pathway across cell types. The bars indicate the sum of the signaling strength of each cell type. (E and F) Circle plot showing differential cell-cell communication networks in the regenerating zebrafish heart. The width of the edges represents the relative number of interactions (E) or interaction strength (F). Arrow indicates target cell. (G and H) Circle plot showing differential cell-cell communication networks in the regenerating neonatal mouse heart. The width of the edges represents the relative number of interactions (G) or interaction strength (H). Arrow indicates target cell. |
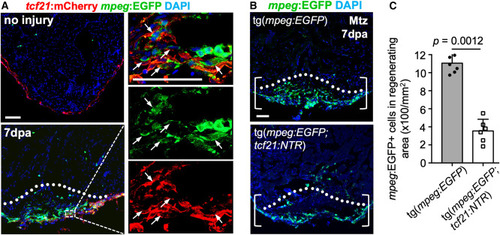
Fb/Epi cells associate with macrophages and are required for macrophage recruitment during heart regeneration (A) Section images of ventricles from uninjured and injured tcf21:mCherry;mpeg:EGFP fish at 7 dpa for macrophage detection. Dashed box area is enlarged to the right. Dashed line indicates the amputation plane. Arrows represent mpeg+ macrophages associated with mCherry+ cells. n = 5. Scale bar, 50 μm. (B) Histological visualization of macrophages with or without epicardial cells in the injury site at 7 dpa, assessed for mpeg+ cells in injured ventricles from tcf21:NTR;mpeg:EGFP animals, and treated with vehicle (n = 7) or metronidazole (Mtz) (n = 6). Dashed line indicates the amputation plane. Brackets represent the wound. Scale bar, 50 μm. (C) Quantification of mpeg+ macrophages in the wound from (B). The experiments were repeated once. Mann-Whitney rank-sum test. |
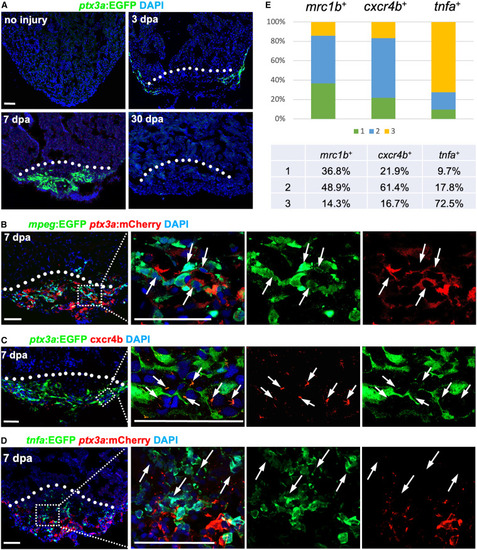
ptx3a+ cells associate with reparative macrophages (A) Histological visualization of ptx3a+ cells in hearts after injury at 0, 3, 7, and 30 dpa. White dashed line indicates amputation plane. n = 6–8 animals. Scale bar, 50 μm. (B) Visualization of ptx3a:EGFP+ cells with mpeg+ macrophages at 7 dpa in the injury site of ptx3a:mCherry;mpeg:EGFP ventricles. Dashed rectangle area is enlarged. Arrows represent mpeg+ macrophages associated with EGFP+ cells. n = 6. Scale bar, 50 μm. (C) The correlation of ptx3a+ cells with cxcr4b expression assessed by cxcr4b antibody staining in injured ventricles of ptx3a:EGFP animals at 7 dpa. Dashed rectangle is enlarged. Arrows represent cxcr4b+ macrophages associated with EGFP+ cells. n = 7. Scale bar, 50 μm. (D) Visualization of ptx3a:EGFP+ cells with tnfa+ macrophages at 7 dpa in the injury site of ptx3a:mCherry;tnfa:EGFP ventricles. Dashed rectangle area is enlarged. Arrows represent tnfa+ macrophages not associated with EGFP+ cells. n = 6. Scale bar, 50 μm. (E) The spatial correlation of macrophages and ptx3a+ cells are quantified by the distance of these cells with three situations: (1) macrophages are surrounded by ptx3a+ cells; (2) macrophages close to ptx3a+ cells within 1 μm except situation 1, and (3) macrophages away from ptx3a+ cells by more than 1 μm. |
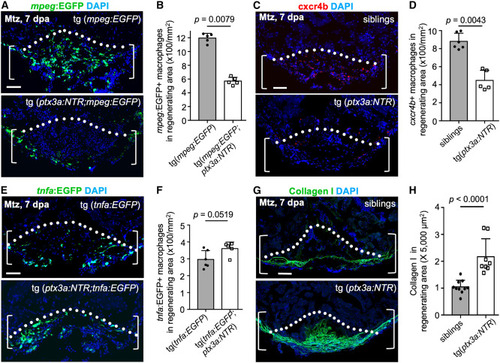
ptx3a+ cell loss results in fewer cxcr4b+ macrophages and elevated collagen deposition (A) Section images of ventricles from ptx3a:NTR;mpeg:EGFP fish with vehicle (n = 5) or Mtz (n = 5) treatment at 7 dpa. Scale bar, 50 μm. (B) Quantification of pixels of mpeg:EGFP+ macrophages in experiment (A). The experiment was repeated once. Mann-Whitney rank-sum test. (C) Section images of ventricles from ptx3a:NTR fish with vehicle (n = 6) or Mtz (n = 5) treatment at 7 dpa assessed by cxcr4b antibody staining. Scale bar, 50 μm. (D) Quantification of pixels of cxcr4b+ macrophages in experiment (C). The experiment was repeated once. Mann-Whitney rank-sum test. (E) Section images of ventricles from ptx3a:NTR;tnfa:EGFP fish with vehicle (n = 6) or Mtz (n = 5) treatment at 7 dpa. Scale bar, 50 μm. (F) Quantification of pixels of tnfa:EGFP+ macrophages in experiment (E). The experiment was repeated once. Mann-Whitney rank-sum test. (G) Section images of ventricles of control siblings (n = 10) and ptx3a:NTR fish with Mtz treatment (n = 8) at 7 dpa assessed with collagen I staining. Scale bar, 50 μm. (H) Quantification of pixels of collagen I+ signals in experiment (G). The experiment was repeated once. Mann-Whitney rank-sum test. |
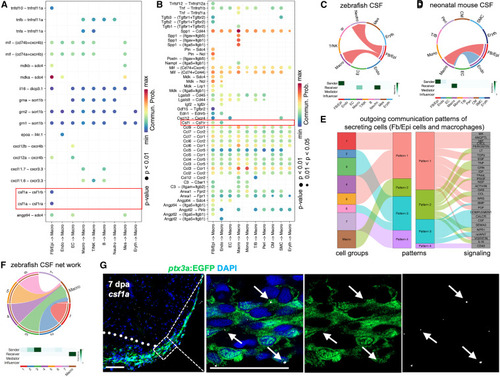
CSF pathway in Fb/Epi cells and macrophages during zebrafish and neonatal mice heart regeneration (A) Dot plot showing incoming communication patterns of macrophages in the regenerating zebrafish heart. The dot color and size represent the calculated communication probability and p values. (B) Dot plot showing incoming communication patterns of macrophages in the regenerating neonatal mouse heart. The dot color and size represent the calculated communication probability and p values. (C) Circle plot showing the inferred CSF signaling network and heatmap displaying its relative importance of each cell group ranked according to the computed four network centrality measures in the regenerating zebrafish heart. Edge width represents the communication probability, and the edge colors are consistent with the color of the sender cell type. (D) Circle plot showing the inferred CSF signaling network and heatmap displaying its relative importance of each cell group ranked according to the computed four network centrality measures in the regenerating neonatal mouse heart. Edge width represents the communication probability, and the edge colors are consistent with the color of the sender cell type. (E) Alluvial plot showing the inferred outgoing communication patterns of epicardial cell subpopulations, which shows the correspondence between the inferred latent patterns and cell groups, as well as signaling pathways. The thickness of the flow indicates the contribution of the cell group or signaling pathway to each latent pattern. (F) Circle plot showing the inferred CSF signaling network outgoing from epicardial subpopulations to macrophages and heatmap displaying its relative importance of each cell group ranked according to the computed four network centrality measures in the regenerating zebrafish heart. Edge width represents the communication probability, and the edge colors are consistent with the color of the sender cell type. (G) Visualization of EGFP+ cells and in situ signals of csf1a mRNA in sectional view of ptx3a:EGFP animals. White dashed line indicates amputation plane. White dashed rectangle is enlarged in images to the right. Red arrowheads indicate in situ signals located in ptx3a+ cells. n = 6. Scale bar, 25 μm. |
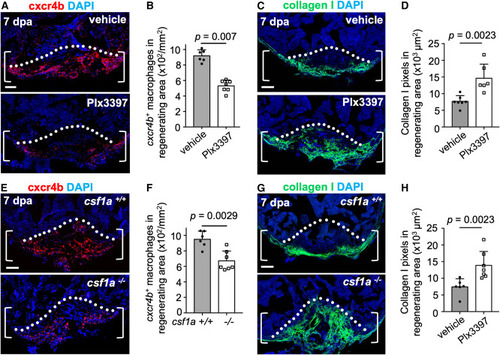
ptx3a+ cells secrete csf1a, and interfering with csf1a function blocks cxcr4b+ macrophage accumulation and collagen resolution (A) Section images of ventricles of vehicle- (n = 6) or Plx3397-treated animals (n = 7) with cxcr4b antibody staining at 7 dpa in each group. Brackets show the injury site used for quantification. Dashed line indicates amputation plane. Scale bars, 50 μm. (B) Quantification of cxcr4b+ macrophages in the injury area from experiments in (B). The experiment was repeated once. Mann-Whitney rank-sum test. (C) Section images of ventricles of vehicle- (n = 7) or Plx3397-treated animals (n = 6) at 7 dpa assessed with collagen I staining. Scale bar, 50 μm. (D) Quantification of pixels of collagen I+ signals in experiment (C). The experiment was repeated once. Mann-Whitney rank-sum test. (E) Section images of ventricles of wild-type siblings (n = 6) and csf1a mutant animals (n = 7) with cxcr4b antibody staining at 7 dpa in each group. Brackets show the injury site used for quantification. Dashed line indicates amputation plane. Scale bars, 50 μm. (F) Quantification of cxcr4b+ macrophages in the injury area from experiments in (E). The experiment was repeated once. Mann-Whitney rank-sum test. (G) Section images of ventricles of wild-type siblings (n = 6) and csf1a mutant animals (n = 7) at 7 dpa assessed with collagen I staining. Scale bar, 50 μm. (H) Quantification of pixels of collagen I+ signals in experiment (G). The experiment was repeated once. Mann-Whitney rank-sum test. |
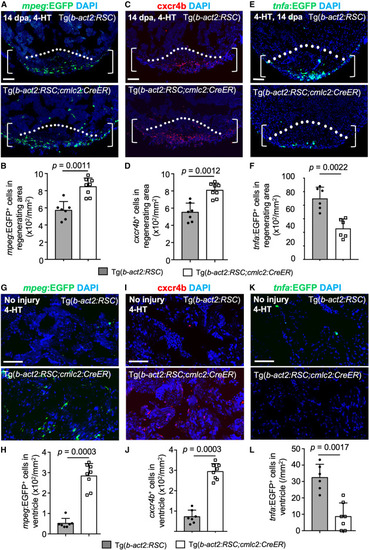
Overexpressing csf1a after heart injury enhances macrophage accumulation and collagen resolution (A) Section images of ventricles of 4-hydroxytamoxifen (4-HT)-treated b-act2:RSC;mpeg:EGFP (n = 7) or b-act2:RSC;cmlc2;CreER;mpeg:EGFP animals (n = 8) at 14 dpa in each group. Brackets show the injury site used for quantification. White dashed line indicates amputation plane. Scale bars, 50 μm. (B) Quantification of EGFP+ macrophages in the injury area from experiments in (A). The experiment was repeated once. Mann-Whitney rank-sum test. (C) Section images of ventricles of 4-HT-treated b-act2:RSC (n = 7) or b-act2:RSC;cmlc2;CreER animals (n = 8) at 14 dpa assessed by cxcr4b antibody staining in each group. Brackets show the injury site used for quantification. White dashed line indicates amputation plane. Scale bars, 50 μm. (D) Quantification of EGFP+ macrophages in the injury area from experiments in (C). The experiment was repeated once. Mann-Whitney rank-sum test. (E) Section images of ventricles of 4-HT-treated b-act2:RSC;tnfa:EGFP (n = 6) or b-act2:RSC;cmlc2;CreER;tnfa:EGFP animals (n = 6) at 14 dpa in each group. Brackets show the injury site used for quantification. White dashed line indicates amputation plane. Scale bars, 50 μm. (F) Quantification of EGFP+ macrophages in the injury area from experiments in (A). The experiment was repeated once. Mann-Whitney rank-sum test. (G) Section images of ventricles of 4-HT-treated b-act2:RSC;mpeg:EGFP (n = 7) or b-act2:RSC;cmlc2;CreER;mpeg:EGFP animals (n = 8) at 14 days post-treatment in each group. Scale bars, 50 μm. (H) Quantification of EGFP+ macrophages in the ventricles from experiments in (A). The experiment was repeated once. Mann-Whitney rank-sum test. (I) Section images of ventricles of 4-HT-treated b-act2:RSC (n = 7) or b-act2:RSC;cmlc2;CreER animals (n = 8) with cxcr4b antibody staining at 14 dpa in each group. Scale bars, 50 μm. (J) Quantification of cxcr4b+ macrophages in the ventricles from experiments in (C). The experiment was repeated once. Mann-Whitney rank-sum test. (K) Section images of ventricles of 4-HT-treated b-act2:RSC;tnfa:EGFP (n = 6) or b-act2:RSC;cmlc2;CreER;tnfa:EGFP animals (n = 7) at 14 days post-treatment in each group. Scale bars, 50 μm. (L) Quantification of EGFP+ macrophages in the ventricles from experiments in (A). The experiment was repeated once. Mann-Whitney rank-sum test. |