
Fig. 3
- ID
- ZDB-FIG-240529-52
- Publication
- Sun et al., 2024 - ptx3a+ fibroblast/epicardial cells provide a transient macrophage niche to promote heart regeneration
- Other Figures
- All Figure Page
- Back to All Figure Page
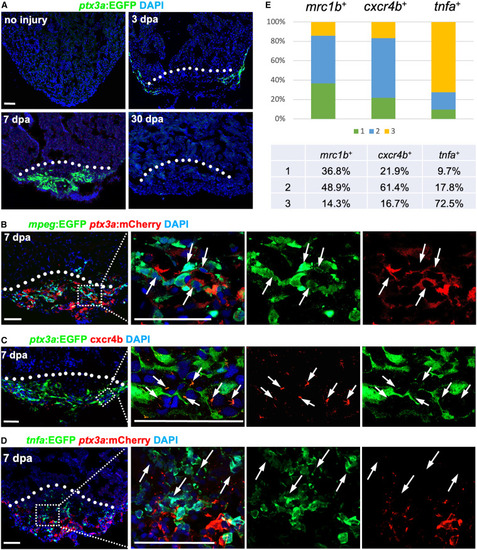
ptx3a+ cells associate with reparative macrophages (A) Histological visualization of ptx3a+ cells in hearts after injury at 0, 3, 7, and 30 dpa. White dashed line indicates amputation plane. n = 6–8 animals. Scale bar, 50 μm. (B) Visualization of ptx3a:EGFP+ cells with mpeg+ macrophages at 7 dpa in the injury site of ptx3a:mCherry;mpeg:EGFP ventricles. Dashed rectangle area is enlarged. Arrows represent mpeg+ macrophages associated with EGFP+ cells. n = 6. Scale bar, 50 μm. (C) The correlation of ptx3a+ cells with cxcr4b expression assessed by cxcr4b antibody staining in injured ventricles of ptx3a:EGFP animals at 7 dpa. Dashed rectangle is enlarged. Arrows represent cxcr4b+ macrophages associated with EGFP+ cells. n = 7. Scale bar, 50 μm. (D) Visualization of ptx3a:EGFP+ cells with tnfa+ macrophages at 7 dpa in the injury site of ptx3a:mCherry;tnfa:EGFP ventricles. Dashed rectangle area is enlarged. Arrows represent tnfa+ macrophages not associated with EGFP+ cells. n = 6. Scale bar, 50 μm. (E) The spatial correlation of macrophages and ptx3a+ cells are quantified by the distance of these cells with three situations: (1) macrophages are surrounded by ptx3a+ cells; (2) macrophages close to ptx3a+ cells within 1 μm except situation 1, and (3) macrophages away from ptx3a+ cells by more than 1 μm. |