
Fig. 5
- ID
- ZDB-FIG-240529-54
- Publication
- Sun et al., 2024 - ptx3a+ fibroblast/epicardial cells provide a transient macrophage niche to promote heart regeneration
- Other Figures
- All Figure Page
- Back to All Figure Page
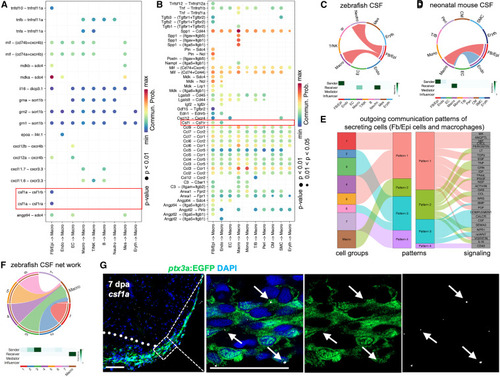
CSF pathway in Fb/Epi cells and macrophages during zebrafish and neonatal mice heart regeneration (A) Dot plot showing incoming communication patterns of macrophages in the regenerating zebrafish heart. The dot color and size represent the calculated communication probability and p values. (B) Dot plot showing incoming communication patterns of macrophages in the regenerating neonatal mouse heart. The dot color and size represent the calculated communication probability and p values. (C) Circle plot showing the inferred CSF signaling network and heatmap displaying its relative importance of each cell group ranked according to the computed four network centrality measures in the regenerating zebrafish heart. Edge width represents the communication probability, and the edge colors are consistent with the color of the sender cell type. (D) Circle plot showing the inferred CSF signaling network and heatmap displaying its relative importance of each cell group ranked according to the computed four network centrality measures in the regenerating neonatal mouse heart. Edge width represents the communication probability, and the edge colors are consistent with the color of the sender cell type. (E) Alluvial plot showing the inferred outgoing communication patterns of epicardial cell subpopulations, which shows the correspondence between the inferred latent patterns and cell groups, as well as signaling pathways. The thickness of the flow indicates the contribution of the cell group or signaling pathway to each latent pattern. (F) Circle plot showing the inferred CSF signaling network outgoing from epicardial subpopulations to macrophages and heatmap displaying its relative importance of each cell group ranked according to the computed four network centrality measures in the regenerating zebrafish heart. Edge width represents the communication probability, and the edge colors are consistent with the color of the sender cell type. (G) Visualization of EGFP+ cells and in situ signals of csf1a mRNA in sectional view of ptx3a:EGFP animals. White dashed line indicates amputation plane. White dashed rectangle is enlarged in images to the right. Red arrowheads indicate in situ signals located in ptx3a+ cells. n = 6. Scale bar, 25 μm. |