
Fig. 7
- ID
- ZDB-FIG-240529-56
- Publication
- Sun et al., 2024 - ptx3a+ fibroblast/epicardial cells provide a transient macrophage niche to promote heart regeneration
- Other Figures
- All Figure Page
- Back to All Figure Page
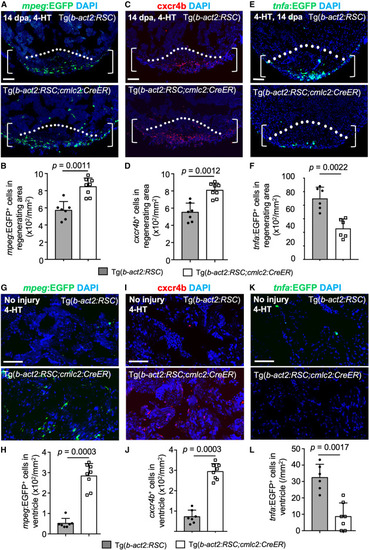
Overexpressing csf1a after heart injury enhances macrophage accumulation and collagen resolution (A) Section images of ventricles of 4-hydroxytamoxifen (4-HT)-treated b-act2:RSC;mpeg:EGFP (n = 7) or b-act2:RSC;cmlc2;CreER;mpeg:EGFP animals (n = 8) at 14 dpa in each group. Brackets show the injury site used for quantification. White dashed line indicates amputation plane. Scale bars, 50 μm. (B) Quantification of EGFP+ macrophages in the injury area from experiments in (A). The experiment was repeated once. Mann-Whitney rank-sum test. (C) Section images of ventricles of 4-HT-treated b-act2:RSC (n = 7) or b-act2:RSC;cmlc2;CreER animals (n = 8) at 14 dpa assessed by cxcr4b antibody staining in each group. Brackets show the injury site used for quantification. White dashed line indicates amputation plane. Scale bars, 50 μm. (D) Quantification of EGFP+ macrophages in the injury area from experiments in (C). The experiment was repeated once. Mann-Whitney rank-sum test. (E) Section images of ventricles of 4-HT-treated b-act2:RSC;tnfa:EGFP (n = 6) or b-act2:RSC;cmlc2;CreER;tnfa:EGFP animals (n = 6) at 14 dpa in each group. Brackets show the injury site used for quantification. White dashed line indicates amputation plane. Scale bars, 50 μm. (F) Quantification of EGFP+ macrophages in the injury area from experiments in (A). The experiment was repeated once. Mann-Whitney rank-sum test. (G) Section images of ventricles of 4-HT-treated b-act2:RSC;mpeg:EGFP (n = 7) or b-act2:RSC;cmlc2;CreER;mpeg:EGFP animals (n = 8) at 14 days post-treatment in each group. Scale bars, 50 μm. (H) Quantification of EGFP+ macrophages in the ventricles from experiments in (A). The experiment was repeated once. Mann-Whitney rank-sum test. (I) Section images of ventricles of 4-HT-treated b-act2:RSC (n = 7) or b-act2:RSC;cmlc2;CreER animals (n = 8) with cxcr4b antibody staining at 14 dpa in each group. Scale bars, 50 μm. (J) Quantification of cxcr4b+ macrophages in the ventricles from experiments in (C). The experiment was repeated once. Mann-Whitney rank-sum test. (K) Section images of ventricles of 4-HT-treated b-act2:RSC;tnfa:EGFP (n = 6) or b-act2:RSC;cmlc2;CreER;tnfa:EGFP animals (n = 7) at 14 days post-treatment in each group. Scale bars, 50 μm. (L) Quantification of EGFP+ macrophages in the ventricles from experiments in (A). The experiment was repeated once. Mann-Whitney rank-sum test. |