
|
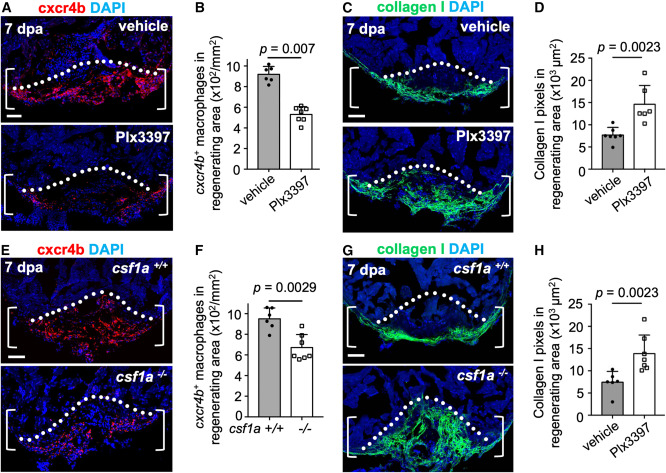
Fig. 6 ptx3a+ cells secrete csf1a, and interfering with csf1a function blocks cxcr4b+ macrophage accumulation and collagen resolution (A) Section images of ventricles of vehicle- (n = 6) or Plx3397-treated animals (n = 7) with cxcr4b antibody staining at 7 dpa in each group. Brackets show the injury site used for quantification. Dashed line indicates amputation plane. Scale bars, 50 μm. (B) Quantification of cxcr4b+ macrophages in the injury area from experiments in (B). The experiment was repeated once. Mann-Whitney rank-sum test. (C) Section images of ventricles of vehicle- (n = 7) or Plx3397-treated animals (n = 6) at 7 dpa assessed with collagen I staining. Scale bar, 50 μm. (D) Quantification of pixels of collagen I+ signals in experiment (C). The experiment was repeated once. Mann-Whitney rank-sum test. (E) Section images of ventricles of wild-type siblings (n = 6) and csf1a mutant animals (n = 7) with cxcr4b antibody staining at 7 dpa in each group. Brackets show the injury site used for quantification. Dashed line indicates amputation plane. Scale bars, 50 μm. (F) Quantification of cxcr4b+ macrophages in the injury area from experiments in (E). The experiment was repeated once. Mann-Whitney rank-sum test. (G) Section images of ventricles of wild-type siblings (n = 6) and csf1a mutant animals (n = 7) at 7 dpa assessed with collagen I staining. Scale bar, 50 μm. (H) Quantification of pixels of collagen I+ signals in experiment (G). The experiment was repeated once. Mann-Whitney rank-sum test.