
|
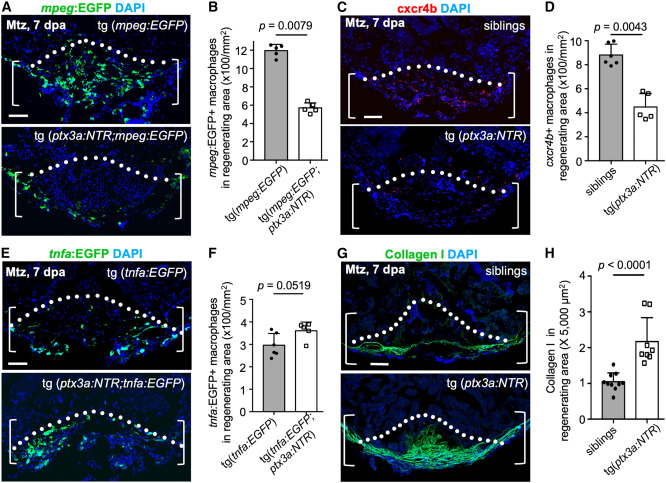
Fig. 4 ptx3a+ cell loss results in fewer cxcr4b+ macrophages and elevated collagen deposition (A) Section images of ventricles from ptx3a:NTR;mpeg:EGFP fish with vehicle (n = 5) or Mtz (n = 5) treatment at 7 dpa. Scale bar, 50 μm. (B) Quantification of pixels of mpeg:EGFP+ macrophages in experiment (A). The experiment was repeated once. Mann-Whitney rank-sum test. (C) Section images of ventricles from ptx3a:NTR fish with vehicle (n = 6) or Mtz (n = 5) treatment at 7 dpa assessed by cxcr4b antibody staining. Scale bar, 50 μm. (D) Quantification of pixels of cxcr4b+ macrophages in experiment (C). The experiment was repeated once. Mann-Whitney rank-sum test. (E) Section images of ventricles from ptx3a:NTR;tnfa:EGFP fish with vehicle (n = 6) or Mtz (n = 5) treatment at 7 dpa. Scale bar, 50 μm. (F) Quantification of pixels of tnfa:EGFP+ macrophages in experiment (E). The experiment was repeated once. Mann-Whitney rank-sum test. (G) Section images of ventricles of control siblings (n = 10) and ptx3a:NTR fish with Mtz treatment (n = 8) at 7 dpa assessed with collagen I staining. Scale bar, 50 μm. (H) Quantification of pixels of collagen I+ signals in experiment (G). The experiment was repeated once. Mann-Whitney rank-sum test.