
- Title
-
Cellular Energy Sensor Sirt1 Augments Mapk Signaling to Promote Hypoxia/Reoxygenation-Induced Catch-up Growth in Zebrafish Embryo
- Authors
- Hayasaka, O., Shibukawa, M., Kamei, H.
- Source
- Full text @ Zool. Sci.
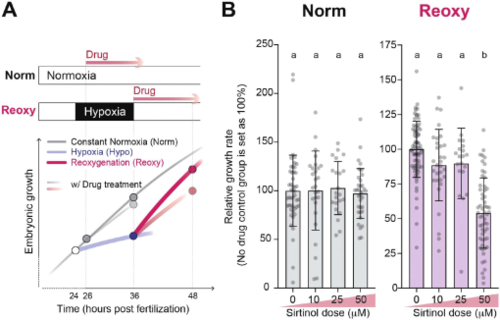
Temporal blockade of Sirt1/2 in embryos growing under constant normal oxygen condition (Norm) and re-oxygenation condition (Reoxy). (A) A diagram showing outline of drug exposure experiments. Sirtinol simultaneously inhibits both Sirt1 and Sirt2 in Norm and Reoxy conditions. Embryos in comparable growth stages were treated with Sirtinol, and the growth rate was analyzed. (B) Changes in growth rate of the Sirtinol-treated embryos in Norm and Reoxy conditions. The control group (DMSO) was set as 100. Values shown are mean ± SD. Data were obtained from two–four independent assays. n = 47 (Norm DMSO); n = 27 (Norm Sirtinol 10 µM); n = 22 (Norm Sirtinol 25 µM); n = 35 (Norm Sirtinol 50 µM); n = 74 (Reoxy DMSO); n = 31 (Reoxy Sirtinol 10 µM); n = 20 (Reoxy Sirtinol 25 µM); n = 57 (Reoxy Sirtinol 50 µM). Different letters mean statistical significance at P < 0.0001. |
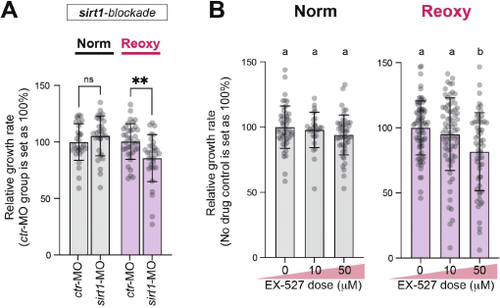
Effect of specific blockade of sirt1 on embryonic growth. (A) Changes in growth rate of sirt1-MO-injected embryos. The relative value is shown. The control group was set as 100. Values are mean ± SD. Data were obtained from three independent assays. n = 30 (Norm ctr-MO); n = 31 (Norm sirt1-MO); n = 37 (Reoxy ctr-MO); n = 32 (Reoxy sirt1-MO). **: P < 0.01; ns: P > 0.05. (B) Changes in growth rate of the EX-527 (Sirt1-specific inhibitor)-treated embryos in Norm and Reoxy conditions. The control group (DMSO) was set as 100. Values shown are mean ± SD. Data were obtained from two–seven independent assays. n = 48 (Norm DMSO); n = 28 (Norm EX-527 10 µM); n = 48 (Norm EX-527 50 µM); n = 76 (Reoxy DMSO); n = 72 (DMSO EX-527 10 µM); n = 59 (DMSO EX-527 50 µM). Different letters mean statistical significance at P < 0.05. |
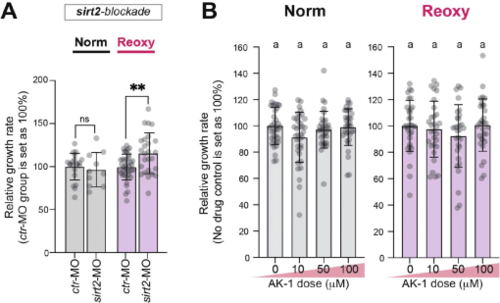
Effect of specific blockade of sirt2 on embryonic growth. (A) Changes in growth rate of sirt2-MO-injected embryos. The relative value is shown. The control group was set as 100. Values are mean ± SD. Data were obtained from two–three independent assays. n = 21 (Norm ctr-MO); n = 10 (Norm sirt2-MO); n = 39 (Reoxy ctr-MO); n = 26 (Reoxy sirt2-MO). **: P < 0.01, ns: P > 0.05. (B) Changes in growth rate of the AK-1 (Sirt2-specific inhibitor)-treated embryos in Norm and Reoxy conditions. The control group (DMSO) was set as 100. Values shown are mean ± SD. Data were obtained from two independent assays. n = 36 (Norm DMSO); n = 36 (Norm AK-1 10 µM); n = 34 (Norm AK-1 50 µM); n = 34 (Norm AK-1 100 µM); n = 32 (Reoxy DMSO); n = 30 (Reoxy AK-1 10 µM); n = 30 (Reoxy AK-1 50 µM); n = 31 (Reoxy AK-1 100 µM). The same letter means statistically not significantly different (P > 0.05). |
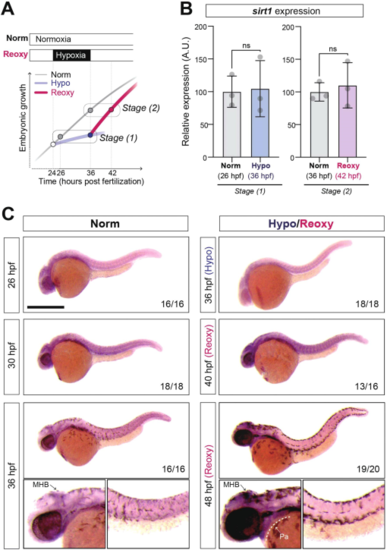
Spatiotemporal expression of sirt1. (A) A diagram showing the sampling stages (Stage (1) and (2)) used for gene expression analyses. The total RNAs extracted from Norm, Hypo, and Reoxy embryos were subjected to further gene expression analyses. (B) RT-qPCR analysis data. Results are shown as the relative expression levels. The control Norm group value was set as 100. Values shown are mean ± SD. Data were obtained from three independent assays. ns: P > 0.05. (C) Whole-mount in situ hybridization analysis. Representative results are shown. Bar, 500 µm. Numbers show the penetrance of the representative result. Arrows represent structures with relatively higher staining signals. MHB, midbrain-hindbrain boundary; Pa, pharyngeal arches. |
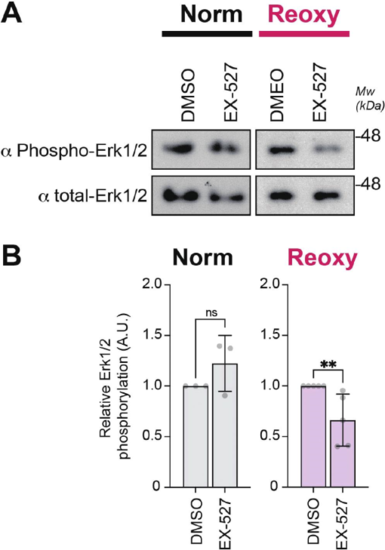
Effects of Sirt1-blockade on Mapk-activation. (A) Representative immunoblotting data. The activation level of Mapk was monitored by measuring relative levels of phospho-Erk1/2. Stage-matched Norm and Reoxy embryos were similarly treated with 50 µM EX-527 and subjected to immunoblot analysis. (B) Quantification data of relative Erk1/2 phosphorylation level. The value of control group (DMSO) was set as 1.0. Values shown are mean ± SD. Data were obtained from three–five independent assays. **: P < 0.01, ns: P > 0.05. |
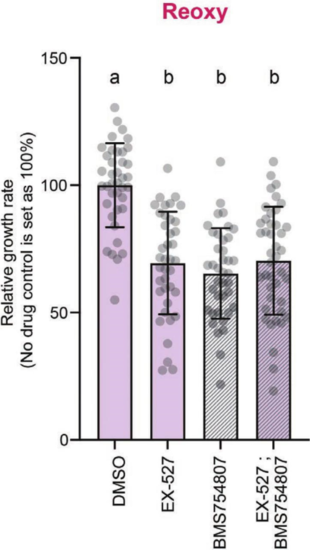
Effects of Sirt1- and Igf1r-blockade on embryonic growth. Embryos at the beginning of Reoxy (36 hpf) were treated with either 50 µM EX-527, 2 µM BMS754807, or their combination for 12 hr. The head-trunk angle was measured before and after the drug treatments to calculate the relative growth rate. The value of control group (DMSO) was set as 100%. Values shown are mean ± SD. Data were obtained from three independent assays. n = 39 (DMSO); n = 39 (EX-527); n = 39 (BMS754807); n = 42 (EX-527; BMS754807). Different letters mean statistical significance at P < 0.0001. |
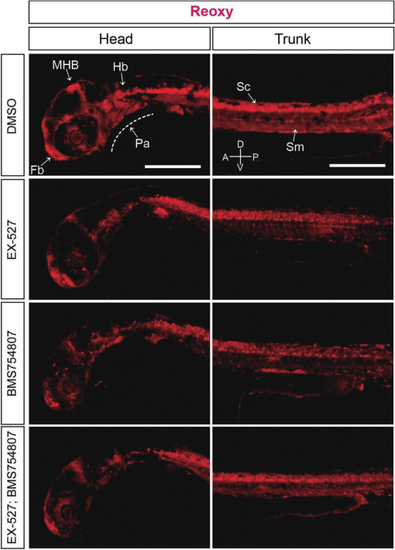
Effects of Sirt1- and Igf1r-blockade on Mapk activation. Whole-mount immunostaining using anti-phospho-Erk1/2 antibody of drug-treated Reoxy embryos. Embryos at the beginning of Reoxy (36 hpf) were treated with either 50 µM EX-527, 2 µM BMS754807, or their combination for 12 hr, and subjected to the immunostaining experiment. Confocal images of each group of embryos are shown. Arrows indicate stronger phospho-Erk1/2-signals in control specimens. Fb, forebrain; Hb, hindbrain; MHB, midbrain-hindbrain boundary; Pa, pharyngeal arches; Sc, spinal cord; Sm, somite muscle. Directions of the specimen are shown by A(anterior)-P(posterior), D(dorsal)-V(ventral) indicator. Bar, 200 µm. |