
Fig. 4
- ID
- ZDB-IMAGE-240517-45
- Publication
- Hayasaka et al., 2024 - Cellular Energy Sensor Sirt1 Augments Mapk Signaling to Promote Hypoxia/Reoxygenation-Induced Catch-up Growth in Zebrafish Embryo
- All Figures
- Figures for Hayasaka et al., 2024
|
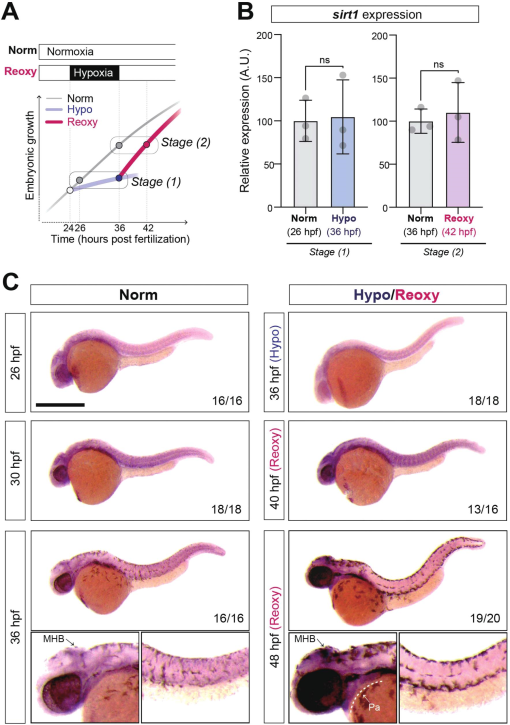
Fig. 4 Spatiotemporal expression of sirt1. (A) A diagram showing the sampling stages (Stage (1) and (2)) used for gene expression analyses. The total RNAs extracted from Norm, Hypo, and Reoxy embryos were subjected to further gene expression analyses. (B) RT-qPCR analysis data. Results are shown as the relative expression levels. The control Norm group value was set as 100. Values shown are mean ± SD. Data were obtained from three independent assays. ns: P > 0.05. (C) Whole-mount in situ hybridization analysis. Representative results are shown. Bar, 500 µm. Numbers show the penetrance of the representative result. Arrows represent structures with relatively higher staining signals. MHB, midbrain-hindbrain boundary; Pa, pharyngeal arches.