FIGURE SUMMARY
Title

The transcription of the main gene associated with Treacher-Collins syndrome (TCOF1) is regulated by G-quadruplexes and cellular nucleic acid binding protein (CNBP)

Authors
Gil Rosas, M., Centola, C., Torres, M., Mouguelar, V.S., David, A.P., Piga, E.J., Gomez, D., Calcaterra, N.B., Armas, P., Coux, G.
Source
Full text @ Sci. Rep.

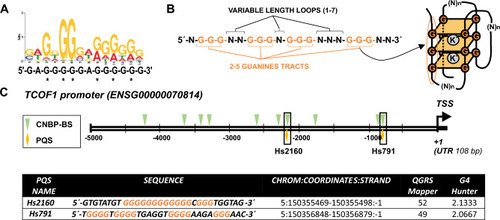
CNBP binding sites and PQSs detected in TCOF1 promoter. (A) Logo (and below the 14-nucleotide consensus sequence) representing CNBP DNA-consensus binding site. CNBP binding sequence was predicted24. Asterisks indicate the six more conserved guanine residues as defined by the authors. (B) PQS consensus and diagram of G4 folding. Guanine-rich sequences capable of forming canonical G-quadruplexes consists in four tracts with 2–5 Guanine (orange), and between them, loops of variable nucleotides with different lengths (black). These kinds of sequences can fold into intramolecular stacked G-tetrads stabilized by coordination with monovalent cations. (C) Scheme of the human TCOF1 EPR (the region between the transcription start site (TSS, indicated with an arrow and + 1) and 5000 bp upstream) detailing the CNBP binding sites (CNBP-BS, green arrowheads) and PQSs (yellow diamonds). The 5′ untranslated region (5′UTR) is indicated by a black box. Below, the table shows the sequences (named according to their distance in bp to the TSS and with the guanine tetrads probably involved G4 formation marked in orange) and coordinates of each PQS that overlapped with CNBP binding sites found in the TCOF1 promoter. Also included are the results (scores) of web-based G4 predicting algorithms, QGRS-Mapper and G4Hunter.

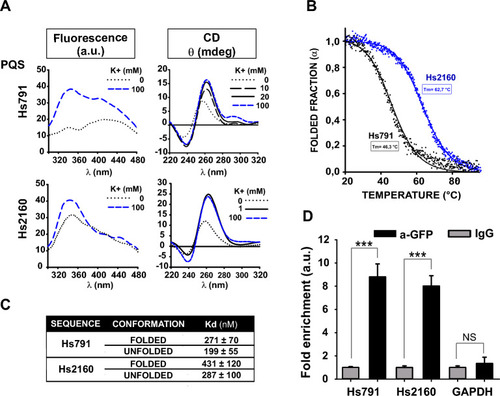
In vitro G4 folding assessment and CNBP binding of the Hs791 and Hs2160 PQSs. (A) DNA intrinsic fluorescence (in arbitrary units (a.u.), left panels) and CD (right panels) spectra of synthetic oligonucleotides representing the PQSs Hs791 (top) and Hs2160 (bottom). The potassium ions concentrations are indicated in the insets. (B) Thermal denaturation curves of synthetic oligonucleotides representing Hs791 (black) and Hs2160 (blue) obtained by monitoring the ellipticity at 260 nm as a function of temperature. Dots correspond to experimental data; lines are fits to a sigmoid function. Estimated melting temperatures (Tm) are informed in the plot. (C) Table reporting Kd ± SEM values obtained in EMSAs for each probe in both folding states. In all cases 3 independent repeats were performed for each probe and folding state. (D) ChIP assays performed on CNBP-eGFP expressing HeLa cells using anti-GFP or anti-IgG control antibodies. Bars represent the average enrichment of qPCR-amplified Hs2160 and Hs791 sequences in immunoprecipitated chromatin with anti-GFP antibody or with control antibody. GAPDH was used as amplification control (gene not regulated by CNBP). In all cases, bars represent the mean ± SD of three independent biological replicates. ***P < 0.001, NS not significant, t test.

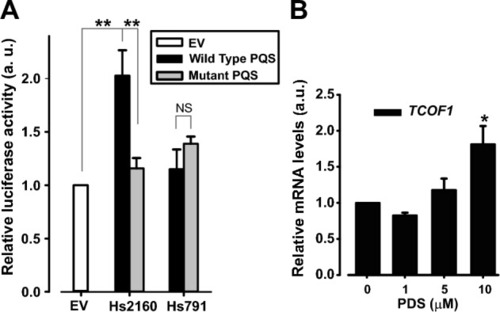
Role of Hs791 and Hs2160 on transcriptional expression control. (A) Luciferase assay performed in HEK293 cells transfected with empty pGL3-promoter vector plasmid (EV, empty vector) or pGL3-promoter vector plasmid containing the wild type (wild-type PQS, black bars) or mutated (mutated PQS, grey bars) sequence of Hs791 and Hs2160 upstream the basal promoter SV40. Each bar represents the luciferase activity normalized to β-galactosidase activity and relativized to empty pGL3-promoter vector plasmid. Bars represent the mean of three independent experiments ± SEM. **P < 0.01, t test. (B) Effect of chemical stabilization of G4 on TCOF1 endogenous transcriptional expression in HEK293 cells. Pyridostatin (PDS), a well-known G4 stabilizer, was added to cells at the indicated concentrations for 15 h. RNA was isolated and TCOF1 expression was analyzed by RT-qPCR. Values are relativized to the non-incubated control (0 PDS). Bars represent the average of 3 independent experiments ± standard error of the mean. NS not significant, *P < 0.05, t test.

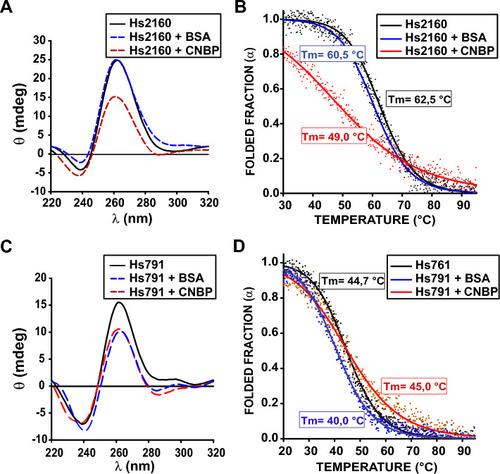
In vitro CNBP action on folded Hs791 and Hs2160. (A) CD spectra of 2 µM synthetic oligonucleotides representing Hs2160 folded as G4 in the absence of protein (black), in the presence of CNBP (1:1 ratio, red) or equimolar BSA as control (blue). (B) CD melting curves obtained for the synthetic oligonucleotides representing Hs2160 obtained in the absence of protein (black), in the presence of BSA as control (blue), or in presence of CNBP (red) at 1:1 molar ratio. Estimated melting temperatures (Tm) are informed in the plot. The dots are experimental values while lines indicate the non-lineal regression plot. (C) Similar to (A) but for folded Hs791. (D) Similar to (B) but for folded Hs791.

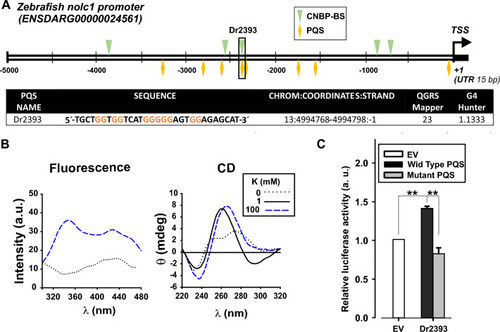
Promoter sequence analysis of the TCOF1 ortholog in Zebrafish. (A) Scheme depicting the nolc1 (TCOF1 functional orthologue) promoter region showing the transcription start site (TSS), the detected CNBP-BS, (green arrowheads) and the PQSs (yellow diamonds). Below, the table shows the sequence (with the G tracts in color) and coordinates of the PQS that overlapped with CNBP-BS found (Dr2393) named according to the distance in bp to the TSS and the scores obtained with the two algorithms for PQS detection. The values obtained were above the threshold value defined by default for each algorithm, indicating a high probability of G4 formation. (B) CD spectra (left) and Intrinsic fluorescence spectroscopy (right) obtained for the synthetic oligonucleotides representing Dr2393 in absence or in presence of different concentrations of K+ (shown in the inset). (C) Luciferase activity assay performed in HEK293 cells transfected with pGL3-promoter vector plasmid (EV, empty vector) or pGL3-promoter vector plasmid containing the wild type (Wild-Type PQS) or mutated (Mutant PQS) sequence of Dr2393 PQS cloned upstream the basal promoter SV40. Each bar represents the luciferase activity normalized to β- galactosidase activity and relativized to that for the empty pGL3-promoter vector plasmid. Bars represent means ± SEM, n = 3, **P < 0.01, t test.

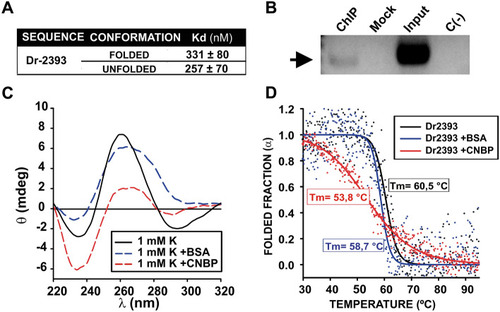
CNBP binding and action over Dr2393. (A) Table summarizing the apparent Kd values (means ± SEM of 3 independent replicates for each state) obtained by EMSAs for the interaction of CNBP and Dr2393, folded as G4 and unfolded. (B) PCR experiment performed on ChIP samples from 24 hpf zebrafish embryos previously microinjected with mRNA coding for CNBP-eGFP. The arrow indicates the positive band in the detection of CNBP binding to Dr2393 in zebrafish embryos. ChIP (immunoprecipitation with anti-eGFP), Mock (immunoprecipitation with unrelated IgG), Input (total genomic DNA sample), C(–)PCR (negative PCR control). (C) CD spectra of 2 µM synthetic oligonucleotides representing Dr2393 folded as G4 in the absence of protein (black), in the presence of CNBP (1:1 ratio, red) or equimolar BSA as control (blue). (D) CD melting curves obtained for the synthetic oligonucleotides representing Dr2393 obtained in the absence of protein (black), in the presence of BSA as control (blue), or in presence of CNBP (red). Estimated melting temperatures (Tm) are informed in the plot. The dots are experimental values while lines indicate the non-lineal regression plot.

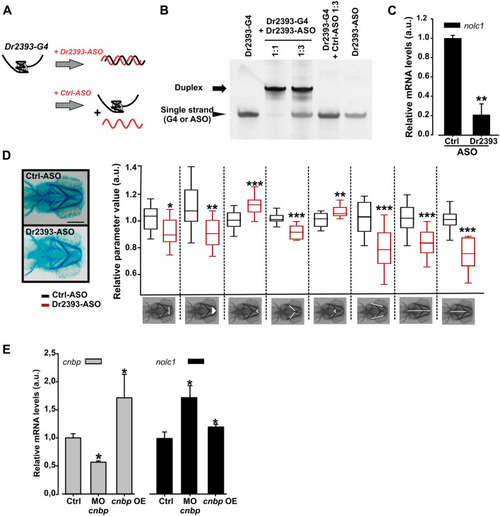
Effect of Dr2393 disruption and CNBP varying levels on zebrafish TCOF1 orthologue expression. (A) Diagram depicting the strategy to specifically block G-quadruplex formation using an antisense oligonucleotide (Dr2393-ASO) microinjected in zebrafish embryos. (B) In vitro testing of the mechanism of ASO action. PAGE gel stained with Sybr Gold showing in the first lane: Dr2393 folded as G4 (Dr2393-G4) and incubated for 2 h at 28 °C, second lane: Dr2393-G4 incubated for 2 h at 28 °C with Dr2393-ASO (molar ratio 1:1), third lane: Dr2393-G4 incubated for 2 h at 28 °C with Dr2393-ASO (molar ratio 1:3), fourth lane: Dr2393-G4 incubated for 2 h at 28 °C with Ctrl-ASO (complementary to an actb2 gene sequence that does not form G4, molar ratio 1:3), fifth lane: Dr2393-ASO. The duplex (Dr2393:Dr2393-ASO) mobility is indicated by an arrow while the mobilities of single-stranded Dr2393 or Dr2393-ASO are showed by an arrowhead. (C) Expression of nolc1 assessed by RT-qPCR in zebrafish embryos (24 hpf) injected at one-cell stage with Dr2393-ASO or Crtl-ASO. Bars represent the mean of three independent experiments ± SEM. **P < 0.01, t test. (D) Representative pictures of ventral views of 5 dpf zebrafish larvae stained with Alcian Blue microinjected with Ctrl-ASO (top) or Dr2393-ASO (bottom) at one-cell stage (Scale bar 200 µm). Larvae as shown in the pictures were photographed and their cranial cartilages were analyzed by quantification of 8 craniofacial measurements as indicated in the pictures below the box plot (from left to right): 1-Transversal Meckel length; 2-area of the inner triangle defined by the Meckel cartilage (Meckel area), 3-internal angle defined by the most anterior Meckel cartilage (Meckel angle); 4-length of ceratohyal cartilages, 5-internal angle defined by ceratohyal cartilages (ceratohyal angle), 6-length of palatoquadrate + hyosymplectic cartilages, 7-distance between the most anterior Meckel and lateral fins (cranial distance) and 8-distance between ceratohyal cartilages joint and lateral fins.). Black boxes: embryos microinjected with Ctrl-ASO (5 nl at 5 ng/µl) at one-cell stage; Red boxes: injected with Dr2393-ASO (same conditions). Bars represent normalized means in arbitrary units (a.u.) ± S.E.M. More than 20 embryos from 3 different experiments were used in each condition. ***P < 0.0005, **P < 0.005, *P < 0.05, t test. (E) Analysis of the effect of Cnbp levels on nolc1 transcriptional expression. Relative abundance of cnbp (gray bars) and nolc1 (black bars) mRNAs measured by RT-qPCR using total RNA from 24 hpf embryos. Ctrl bar: RNA from microinjected embryos with control Morpholino or from non-fluorescent XIa.Eefiai:cnbpa-EGFP embryos (respectively), MO cnbp bar: embryos microinjected with Morpholino blocking cnbp translation and Cnbp OE bar: RNA from fluorescent transgenic XIa.Eefiai:cnbpa-EGFP embryos. Bars represent mean relative abundances ± S.E.M., n: 3. *P < 0.05, t test.

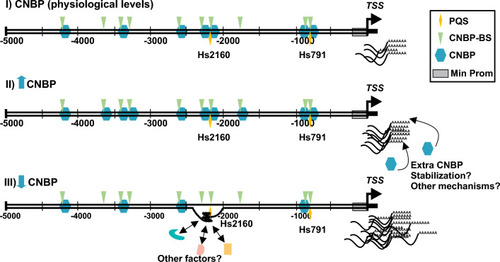
Diagram depicting the working model of TCOF1 transcriptional regulation by G4 and CNBP. Three different conditions showing the possible regulation of TCOF1. (I) Under physiological conditions, several CNBP binding sites in the TCOF1 promoter are occupied by CNBP, Hs2160 is unfolded and transcription proceeds normally. (II) Under high CNBP levels, probably all sites are occupied and extra CNBP may support TCOF1 expression by alternative ways (e.g. mRNA stabilization) either directly or indirectly. (III) Under low CNBP levels, less sites are occupied and Hs2160 has the chance to fold as a G4. Folded Hs2160 can recruit extra factors and induce TCOF1 transcription.

Acknowledgments
This image is the copyrighted work of the attributed author or publisher, and ZFIN has permission only to display this image to its users. Additional permissions should be obtained from the applicable author or publisher of the image. Full text @ Sci. Rep.