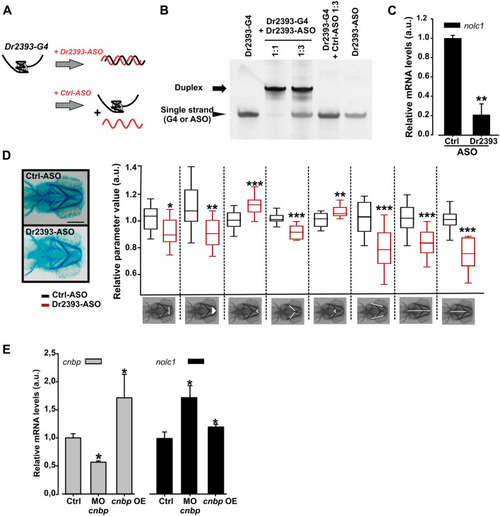
Effect of Dr2393 disruption and CNBP varying levels on zebrafish TCOF1 orthologue expression. (A) Diagram depicting the strategy to specifically block G-quadruplex formation using an antisense oligonucleotide (Dr2393-ASO) microinjected in zebrafish embryos. (B) In vitro testing of the mechanism of ASO action. PAGE gel stained with Sybr Gold showing in the first lane: Dr2393 folded as G4 (Dr2393-G4) and incubated for 2 h at 28 °C, second lane: Dr2393-G4 incubated for 2 h at 28 °C with Dr2393-ASO (molar ratio 1:1), third lane: Dr2393-G4 incubated for 2 h at 28 °C with Dr2393-ASO (molar ratio 1:3), fourth lane: Dr2393-G4 incubated for 2 h at 28 °C with Ctrl-ASO (complementary to an actb2 gene sequence that does not form G4, molar ratio 1:3), fifth lane: Dr2393-ASO. The duplex (Dr2393:Dr2393-ASO) mobility is indicated by an arrow while the mobilities of single-stranded Dr2393 or Dr2393-ASO are showed by an arrowhead. (C) Expression of nolc1 assessed by RT-qPCR in zebrafish embryos (24 hpf) injected at one-cell stage with Dr2393-ASO or Crtl-ASO. Bars represent the mean of three independent experiments ± SEM. **P < 0.01, t test. (D) Representative pictures of ventral views of 5 dpf zebrafish larvae stained with Alcian Blue microinjected with Ctrl-ASO (top) or Dr2393-ASO (bottom) at one-cell stage (Scale bar 200 µm). Larvae as shown in the pictures were photographed and their cranial cartilages were analyzed by quantification of 8 craniofacial measurements as indicated in the pictures below the box plot (from left to right): 1-Transversal Meckel length; 2-area of the inner triangle defined by the Meckel cartilage (Meckel area), 3-internal angle defined by the most anterior Meckel cartilage (Meckel angle); 4-length of ceratohyal cartilages, 5-internal angle defined by ceratohyal cartilages (ceratohyal angle), 6-length of palatoquadrate + hyosymplectic cartilages, 7-distance between the most anterior Meckel and lateral fins (cranial distance) and 8-distance between ceratohyal cartilages joint and lateral fins.). Black boxes: embryos microinjected with Ctrl-ASO (5 nl at 5 ng/µl) at one-cell stage; Red boxes: injected with Dr2393-ASO (same conditions). Bars represent normalized means in arbitrary units (a.u.) ± S.E.M. More than 20 embryos from 3 different experiments were used in each condition. ***P < 0.0005, **P < 0.005, *P < 0.05, t test. (E) Analysis of the effect of Cnbp levels on nolc1 transcriptional expression. Relative abundance of cnbp (gray bars) and nolc1 (black bars) mRNAs measured by RT-qPCR using total RNA from 24 hpf embryos. Ctrl bar: RNA from microinjected embryos with control Morpholino or from non-fluorescent XIa.Eefiai:cnbpa-EGFP embryos (respectively), MO cnbp bar: embryos microinjected with Morpholino blocking cnbp translation and Cnbp OE bar: RNA from fluorescent transgenic XIa.Eefiai:cnbpa-EGFP embryos. Bars represent mean relative abundances ± S.E.M., n: 3. *P < 0.05, t test.
|
