IMAGE

Figure 7

ID
ZDB-IMAGE-240401-46
Source
Figures for Gil Rosas et al., 2024
Image
Figure Caption

Figure 7

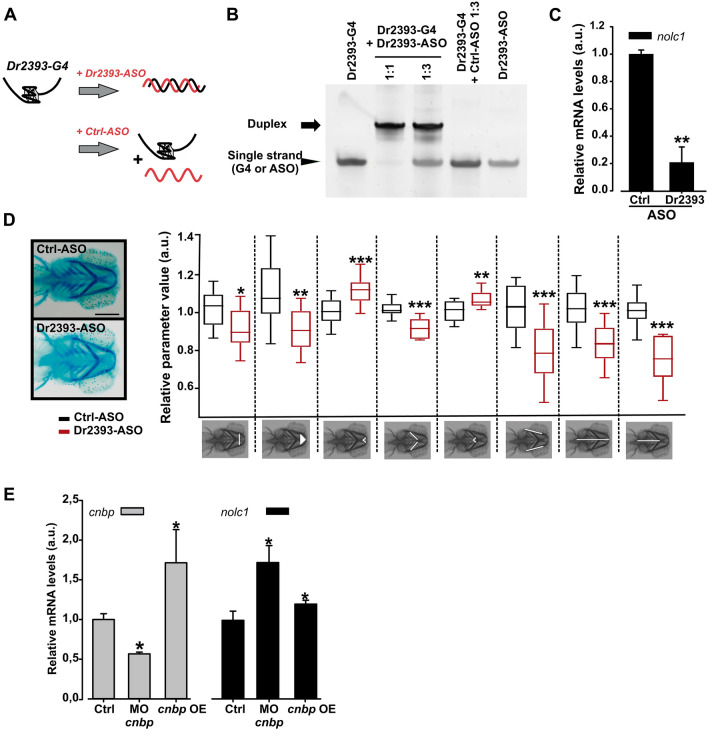
Effect of Dr2393 disruption and CNBP varying levels on zebrafish TCOF1 orthologue expression. (A) Diagram depicting the strategy to specifically block G-quadruplex formation using an antisense oligonucleotide (Dr2393-ASO) microinjected in zebrafish embryos. (B) In vitro testing of the mechanism of ASO action. PAGE gel stained with Sybr Gold showing in the first lane: Dr2393 folded as G4 (Dr2393-G4) and incubated for 2 h at 28 °C, second lane: Dr2393-G4 incubated for 2 h at 28 °C with Dr2393-ASO (molar ratio 1:1), third lane: Dr2393-G4 incubated for 2 h at 28 °C with Dr2393-ASO (molar ratio 1:3), fourth lane: Dr2393-G4 incubated for 2 h at 28 °C with Ctrl-ASO (complementary to an actb2 gene sequence that does not form G4, molar ratio 1:3), fifth lane: Dr2393-ASO. The duplex (Dr2393:Dr2393-ASO) mobility is indicated by an arrow while the mobilities of single-stranded Dr2393 or Dr2393-ASO are showed by an arrowhead. (C) Expression of nolc1 assessed by RT-qPCR in zebrafish embryos (24 hpf) injected at one-cell stage with Dr2393-ASO or Crtl-ASO. Bars represent the mean of three independent experiments ± SEM. **P < 0.01, t test. (D) Representative pictures of ventral views of 5 dpf zebrafish larvae stained with Alcian Blue microinjected with Ctrl-ASO (top) or Dr2393-ASO (bottom) at one-cell stage (Scale bar 200 µm). Larvae as shown in the pictures were photographed and their cranial cartilages were analyzed by quantification of 8 craniofacial measurements as indicated in the pictures below the box plot (from left to right): 1-Transversal Meckel length; 2-area of the inner triangle defined by the Meckel cartilage (Meckel area), 3-internal angle defined by the most anterior Meckel cartilage (Meckel angle); 4-length of ceratohyal cartilages, 5-internal angle defined by ceratohyal cartilages (ceratohyal angle), 6-length of palatoquadrate + hyosymplectic cartilages, 7-distance between the most anterior Meckel and lateral fins (cranial distance) and 8-distance between ceratohyal cartilages joint and lateral fins.). Black boxes: embryos microinjected with Ctrl-ASO (5 nl at 5 ng/µl) at one-cell stage; Red boxes: injected with Dr2393-ASO (same conditions). Bars represent normalized means in arbitrary units (a.u.) ± S.E.M. More than 20 embryos from 3 different experiments were used in each condition. ***P < 0.0005, **P < 0.005, *P < 0.05, t test. (E) Analysis of the effect of Cnbp levels on nolc1 transcriptional expression. Relative abundance of cnbp (gray bars) and nolc1 (black bars) mRNAs measured by RT-qPCR using total RNA from 24 hpf embryos. Ctrl bar: RNA from microinjected embryos with control Morpholino or from non-fluorescent XIa.Eefiai:cnbpa-EGFP embryos (respectively), MO cnbp bar: embryos microinjected with Morpholino blocking cnbp translation and Cnbp OE bar: RNA from fluorescent transgenic XIa.Eefiai:cnbpa-EGFP embryos. Bars represent mean relative abundances ± S.E.M., n: 3. *P < 0.05, t test.

Acknowledgments
This image is the copyrighted work of the attributed author or publisher, and ZFIN has permission only to display this image to its users. Additional permissions should be obtained from the applicable author or publisher of the image. Full text @ Sci. Rep.