IMAGE

Figure 4

ID
ZDB-IMAGE-240401-44
Source
Figures for Gil Rosas et al., 2024
Image
Figure Caption

Figure 4

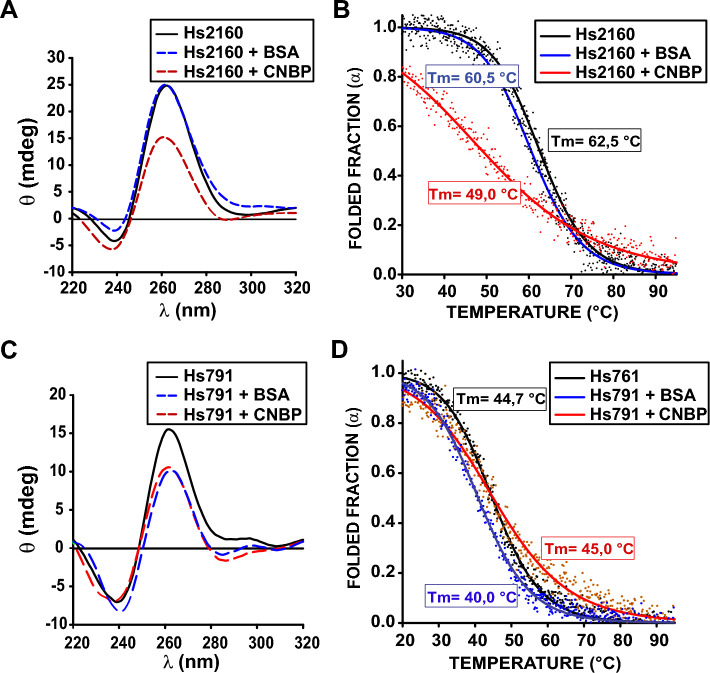
In vitro CNBP action on folded Hs791 and Hs2160. (A) CD spectra of 2 µM synthetic oligonucleotides representing Hs2160 folded as G4 in the absence of protein (black), in the presence of CNBP (1:1 ratio, red) or equimolar BSA as control (blue). (B) CD melting curves obtained for the synthetic oligonucleotides representing Hs2160 obtained in the absence of protein (black), in the presence of BSA as control (blue), or in presence of CNBP (red) at 1:1 molar ratio. Estimated melting temperatures (Tm) are informed in the plot. The dots are experimental values while lines indicate the non-lineal regression plot. (C) Similar to (A) but for folded Hs791. (D) Similar to (B) but for folded Hs791.

Acknowledgments
This image is the copyrighted work of the attributed author or publisher, and ZFIN has permission only to display this image to its users. Additional permissions should be obtained from the applicable author or publisher of the image. Full text @ Sci. Rep.