IMAGE

Figure 6

ID
ZDB-IMAGE-240401-40
Source
Figures for Gil Rosas et al., 2024
Image
Figure Caption

Figure 6

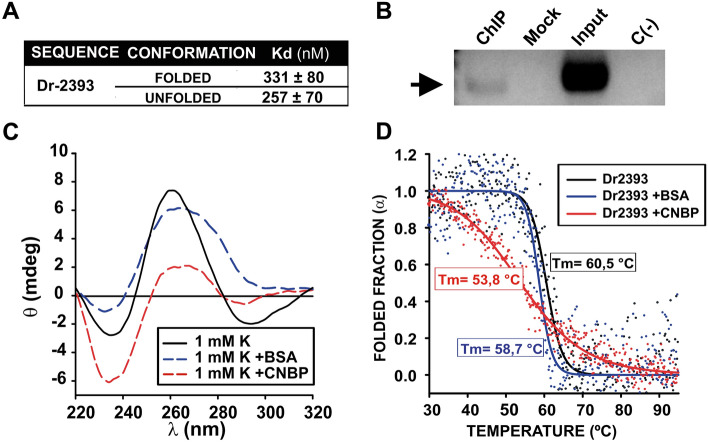
CNBP binding and action over Dr2393. (A) Table summarizing the apparent Kd values (means ± SEM of 3 independent replicates for each state) obtained by EMSAs for the interaction of CNBP and Dr2393, folded as G4 and unfolded. (B) PCR experiment performed on ChIP samples from 24 hpf zebrafish embryos previously microinjected with mRNA coding for CNBP-eGFP. The arrow indicates the positive band in the detection of CNBP binding to Dr2393 in zebrafish embryos. ChIP (immunoprecipitation with anti-eGFP), Mock (immunoprecipitation with unrelated IgG), Input (total genomic DNA sample), C(–)PCR (negative PCR control). (C) CD spectra of 2 µM synthetic oligonucleotides representing Dr2393 folded as G4 in the absence of protein (black), in the presence of CNBP (1:1 ratio, red) or equimolar BSA as control (blue). (D) CD melting curves obtained for the synthetic oligonucleotides representing Dr2393 obtained in the absence of protein (black), in the presence of BSA as control (blue), or in presence of CNBP (red). Estimated melting temperatures (Tm) are informed in the plot. The dots are experimental values while lines indicate the non-lineal regression plot.

Acknowledgments
This image is the copyrighted work of the attributed author or publisher, and ZFIN has permission only to display this image to its users. Additional permissions should be obtained from the applicable author or publisher of the image. Full text @ Sci. Rep.