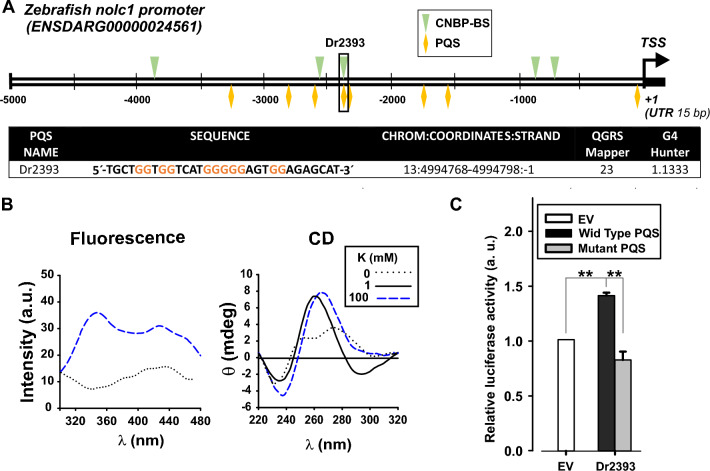
IMAGE

Figure 5

ID
ZDB-IMAGE-240401-45
Source
Figures for Gil Rosas et al., 2024
Image
Figure Caption

Figure 5

Promoter sequence analysis of the TCOF1 ortholog in Zebrafish. (A) Scheme depicting the nolc1 (TCOF1 functional orthologue) promoter region showing the transcription start site (TSS), the detected CNBP-BS, (green arrowheads) and the PQSs (yellow diamonds). Below, the table shows the sequence (with the G tracts in color) and coordinates of the PQS that overlapped with CNBP-BS found (Dr2393) named according to the distance in bp to the TSS and the scores obtained with the two algorithms for PQS detection. The values obtained were above the threshold value defined by default for each algorithm, indicating a high probability of G4 formation. (B) CD spectra (left) and Intrinsic fluorescence spectroscopy (right) obtained for the synthetic oligonucleotides representing Dr2393 in absence or in presence of different concentrations of K+ (shown in the inset). (C) Luciferase activity assay performed in HEK293 cells transfected with pGL3-promoter vector plasmid (EV, empty vector) or pGL3-promoter vector plasmid containing the wild type (Wild-Type PQS) or mutated (Mutant PQS) sequence of Dr2393 PQS cloned upstream the basal promoter SV40. Each bar represents the luciferase activity normalized to β- galactosidase activity and relativized to that for the empty pGL3-promoter vector plasmid. Bars represent means ± SEM, n = 3, **P < 0.01, t test.

Acknowledgments
This image is the copyrighted work of the attributed author or publisher, and ZFIN has permission only to display this image to its users. Additional permissions should be obtained from the applicable author or publisher of the image. Full text @ Sci. Rep.