FIGURE SUMMARY
Title

Photoreceptor calyceal processes accompany the developing outer segment, adopting a stable length despite a dynamic core

Authors
Sharkova, M., Aparicio, G., Mouzaaber, C., Zolessi, F.R., Hocking, J.C.
Source
Full text @ J. Cell Sci.

CP parameters for photoreceptor subtypes in the juvenile zebrafish retina. (A) Confocal images of 1 mpf retinas stained with phalloidin (cyan). Shown are a dark-adapted rod [DA; Tg(rho:eGFP)], light-adapted double cone (DC) [LA wild-type (WT) stained with PNA and zpr1], blue cone (BC) (LA WT stained with anti-blue opsin) and UV-sensitive cone (UVS) [LA Tg(sws1:GFP)]; CP length is indicated by arrows. (B) Sagittal section through a 1 mpf DA Tg(rho:eGFP) retina (rods in orange) labelled with phalloidin (cyan). BC and DC OSs are outlined. For CP number, mean±s.d. are shown; n=5 fish. (C,D) Graphs displaying CP length (C) and CP length relative to the OS length (D) for LA DC, LA BC, LA UVS cones, and DA rods; number of fish n=9 (DC, BC, UVS), n=7 (rod). (E) Graph showing CP diameter measured in rods, DC, and UVS cones in TEM images of 1 mpf WT retina, with individual measurements plotted; number of fish n=5. In C–E, the line highlights the median. ns, not significant (P>0.05), *P<0.05, **P<0.01, ****P<0.0001 (one-way ANOVA with Tukey's test). (F) Example of TEM imaging used for measuring CP diameter. Lower magnification image showing the rod OS, IS and a CP, with a yellow contour indicating the area in F′, where CP diameter is labelled. Scale bars: 5 µm (A), 10 µm (B), 1 µm (F), 200 nm (F′).

Retinomotor movements and CP length in dark-adapted and light-adapted 1 mpf zebrafish retina. (A) Confocal images of 1 mpf DA and LA outer retina sections stained with phalloidin (cyan). From left to right, top to bottom: rods (Tg(rho:eGFP)), double cones (DC) [wild-type (WT) stained with PNA and zpr1], blue cones (BC) (WT stained with anti-blue opsin), UV-sensitive cones (UVS) [Tg(sws1:GFP)]. Scale bars: 20 µm. (B) Schematic depiction of measurement for the IS–OLM distance. (C) Graphs showing the extent of cellular retinomotor movements as the distance between the apical IS and the OLM in each photoreceptor cell type for DA versus LA state. (D) Graphs displaying the CP length in photoreceptors in DA versus LA fish. Statistics: number of fish n=9 (rods, DC, BC, UVS), n=7 (rod DA CP length), n=4 (rod LA CP length); the line highlights the median. ns, not significant (P>0.05), *P<0.05, **P<0.01 (two-tailed unpaired t-tests with Welch's correction).

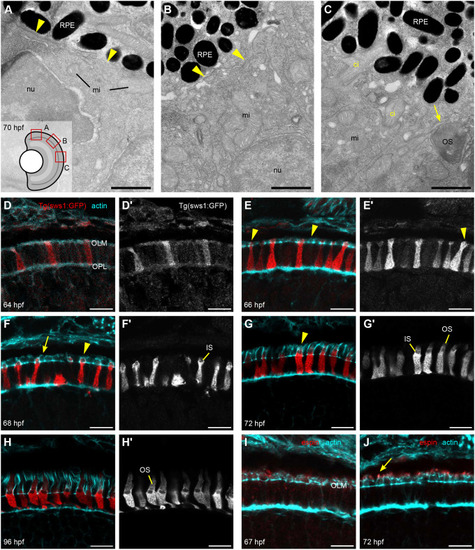
Details of IS, OS, and CP development in zebrafish retina. (A–C) TEM micrographs depicting the progression of IS and OS development in 70 hpf wild-type embryonic retinas. A small schematic inset in A shows the approximate position of each panel. (A) In the peripheral retina, the photoreceptor–RPE interface is flat, with an isolated apical photoreceptor process extending parallel to the interface, as indicated by arrowheads. mi, mitochondria; nu, nucleus. (B) When moving away from the periphery, processes (arrowheads) can be observed emerging from both the RPE and photoreceptor apical surfaces, creating an interdigitating IS–RPE interface. (C) In the dorsocentral region, one photoreceptor has an OS with well-developed discs and a visible adjacent CP (arrow), while two other photoreceptors are at the emerging cilium (ci) stage. (D–H) Confocal images of Tg(sws1:GFP) (red) outer retina sections at 64, 66, 68, 72, and 96 hpf stained with phalloidin (cyan). (D) Early photoreceptors with columnar morphology and an actin-rich apical domain, but no distinct ISs. (E) Arrowheads point at actin dome-like structure in the IS. (E′) Filopodia emerging from IS apical surface (arrowhead). (F) Different IS and actin dome shapes: round and rectangular (arrow and arrowhead, respectively). (G) Arrowhead indicates CPs. (I,J) Confocal images of 67 and 72 hpf outer retina sections stained with phalloidin (cyan) and anti-espin (red). (J) An arrow highlights espin localization to the CPs in 72 hpf fish. Number of fish analysed: n=3 (A–C), n=7 (D), n=5 (E), n=8 (F,G), n=6 (H), n=4 (I,J). Scale bars: 1 µm (A–C), 10 µm (D–J).

Tangential processes on photoreceptor progenitors and differentiating photoreceptors in the 72 hpf retina. (A) Apical view of the peripheral-most crx:EGFP-CAAX (crx:GFP) expression area, showing a few photoreceptor progenitors profusely extending tangential processes (arrowheads). F-actin staining with TRITC–phalloidin highlights the subapical adhesion rings. (A′) Diagram depicting the orientation of acquisition in A; L, lens; NR, neural retina. (B) Time-lapse experiment of crx:GFP-injected embryos, showing a peripheral area of the retina displaying photoreceptor progenitors extending highly dynamic tangential processes on the apical surface (arrowheads). (C) Early differentiating photoreceptor, displaying long tangential processes (arrowheads). (D) Differentiating photoreceptors at the IS-forming stage, showing short processes extending from this expanding apical membrane. Some of the processes are connected at the OLM, indicating they might be tangential processes (yellow arrowheads), whereas others originate at more apical positions and extend in different directions (white arrowheads). Number of embryos analysed: n=8 (A,C,D), n=4 (B). Scale bars: 5 µm.

Induced actin is incorporated into CP cores in zebrafish. (A) Diagram representing various components of the construct injected into one-cell stage WT embryos. Arrow indicates direction of transcription for EGFP. (B–E) Micrographs of Tg(hsp:act-myc) zebrafish retina stained with phalloidin (cyan) and anti-Myc (red) antibody. (B) Control 1 mpf Tg(hsp:act-myc) eye. (C) Eye of 1 mpf Tg(hsp:act-myc) fish 24 h after heat shock (HS). (D,D′) Higher magnification of the photoreceptor layer of a heat-shock-treated 1 mpf fish; arrow in D′ points at a rod IS; inset shows enlarged yellow box contents from D′, arrowheads highlight Myc localization to CPs. (E) 3 dpf Tg(hsp:act-myc) embryo 6 h after heat shock. (E′) Yellow box indicates position of enlarged area in the inset. Actin–Myc expression is in the IS actin dome (arrow) and in the CPs (arrowhead). Number of fish analysed: n=11 (B), n=12 (C), n=7 (D), n=11 (E). Scale bars: 100 µm (B,C), 20 µm (D–E′, main images), 5 µm (D′,E′, insets).

Zebrafish Müller glial and RPE protrusions enclose UVS cone OSs. (A–C) Confocal images of 1 mpf zebrafish retinal sections incubated with phalloidin (cyan) and UV opsin or zpr2 antibody (magenta). (A) Tg(gfap:GFP) zebrafish with Müller glia cell bodies highlighted by GFP (orange) show long glial processes above the OLM stretching alongside UVS cone OSs and colocalizing with thick actin bundles (arrowheads). (B) Sagittal section through Tg(rho:eGFP) retina with an enlarged area demonstrating rod ISs (orange) adjacent to thick actin bundles (arrowhead) surrounding UVS cones OSs. (C) RPE apical processes, stained with zpr2 antibody, extend towards the OLM and localize in close proximity to the apical Müller glial processes (arrowhead), as observed in Tg(gfap:GFP) retina. (D) A model illustrating the organization of supporting cells in the photoreceptor layer. UVS cones feature both Müller glial and RPE protrusions around the OS. Number of fish analysed: n=3 (A,C), n=5 (B). Scale bars: 20 µm.

Diagram depicting stages of photoreceptor CP, IS and OS development in embryonic zebrafish. From left to right: CPs, the IS and the OS of zebrafish photoreceptors undergo distinct alterations during development. First on the left: no distinct IS is observed; photoreceptors feature tangential processes apically, an actin ring at the OLM and a flat RPE–IS interface. Next, the IS becomes prominent, outlined by an actin dome, and vertical processes (presumably CP precursors) appear, while the RPE–IS interface becomes rougher. Tangential processes originating near the OLM area are retained. Further along, a cilium, the future OS, emerges and enters the RPE pocket, with no processes adjacent to it. Finally, the cilium starts generating discs, the CPs associate with the new OS, and the IS becomes more rectangular in shape. Please note that the diagram does not accurately depict relative sizes of photoreceptors and RPE in order to highlight the apical region of the former.

Acknowledgments
This image is the copyrighted work of the attributed author or publisher, and ZFIN has permission only to display this image to its users. Additional permissions should be obtained from the applicable author or publisher of the image. Full text @ J. Cell Sci.